

Comparative functional genomics analysis of NNK tobacco-carcinogen induced lung adenocarcinoma development in Gprc5a-knockout mice
- PMID: 20686609
- PMCID: PMC2912294
- DOI: 10.1371/journal.pone.0011847
Comparative functional genomics analysis of NNK tobacco-carcinogen induced lung adenocarcinoma development in Gprc5a-knockout mice
Abstract
Background: Improved understanding of lung cancer development and progression, including insights from studies of animal models, are needed to combat this fatal disease. Previously, we found that mice with a knockout (KO) of G-protein coupled receptor 5A (Gprc5a) develop lung tumors after a long latent period (12 to 24 months).
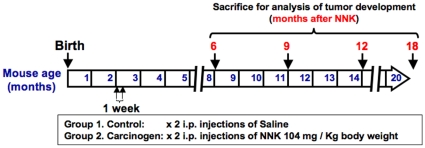
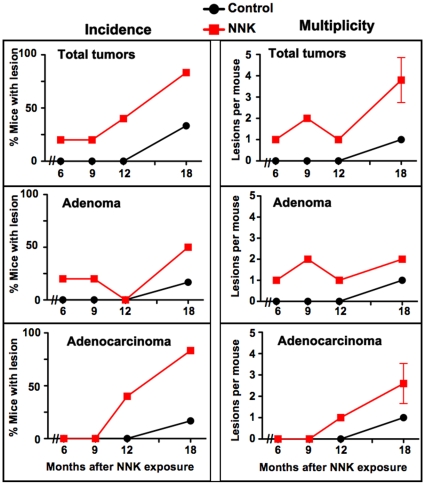
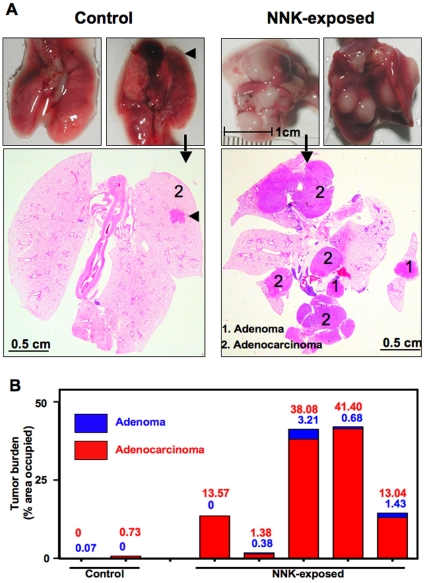
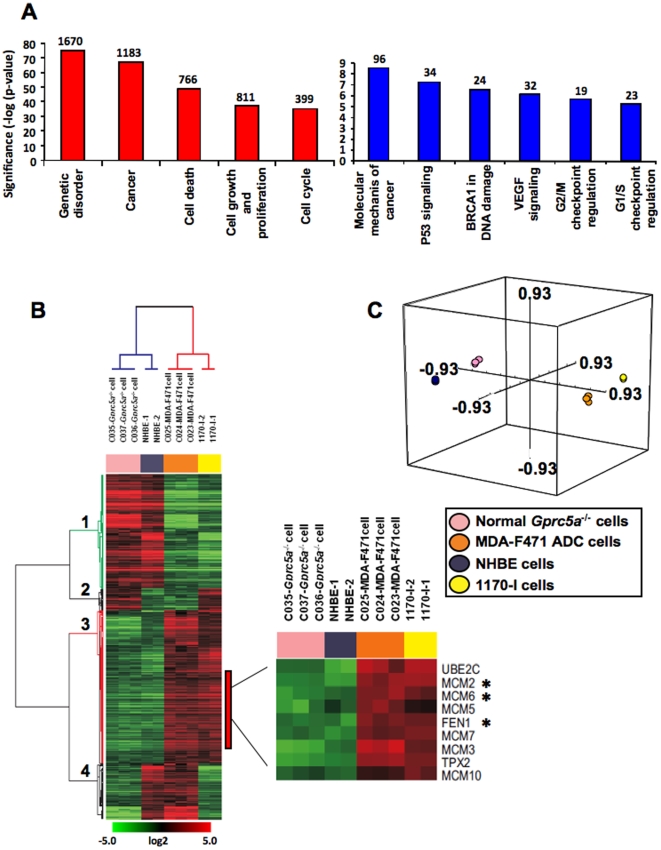
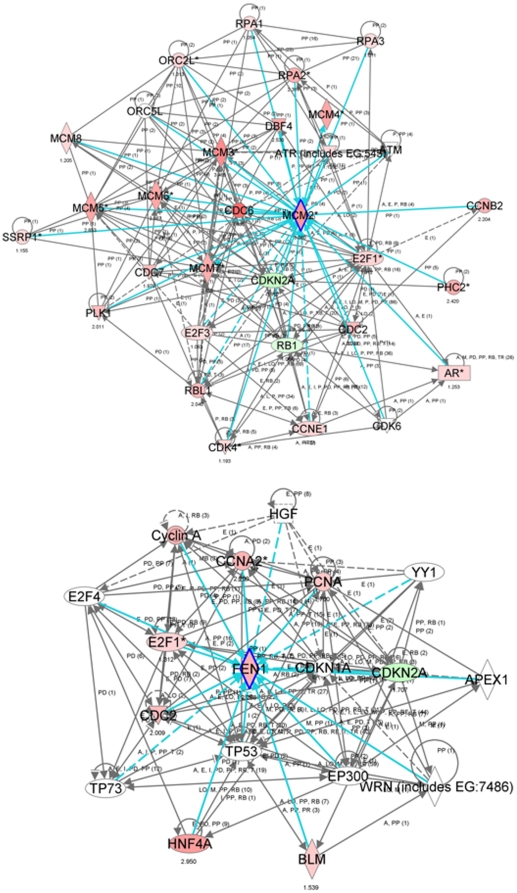
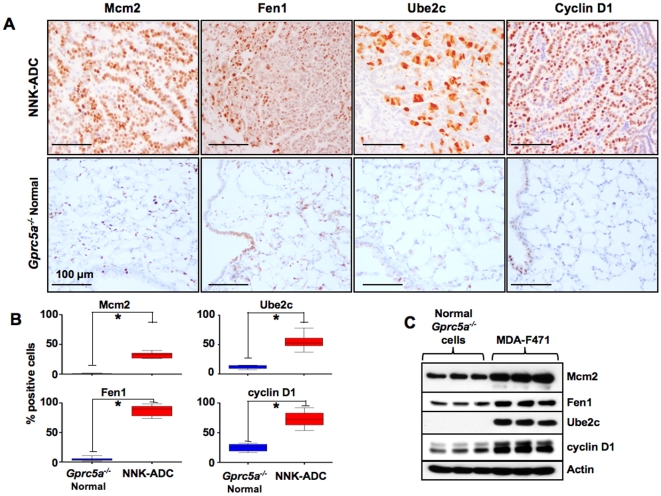
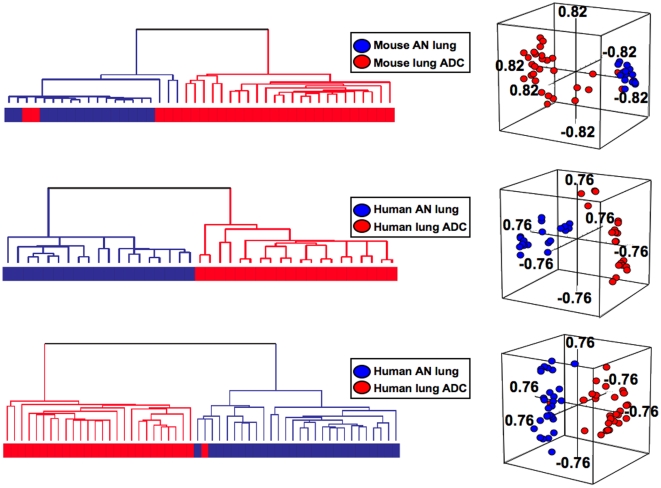
Methodology/principal findings: To determine whether a tobacco carcinogen will enhance tumorigenesis in this model, we administered 4-(methylnitrosamino)-1-(3-pyridyl)-1-butanone (NNK) i.p. to 2-months old Gprc5a-KO mice and sacrificed groups (n=5) of mice at 6, 9, 12, and 18 months later. Compared to control Gprc5a-KO mice, NNK-treated mice developed lung tumors at least 6 months earlier, exhibited 2- to 4-fold increased tumor incidence and multiplicity, and showed a dramatic increase in lesion size. A gene expression signature, NNK-ADC, of differentially expressed genes derived by transcriptome analysis of epithelial cell lines from normal lungs of Gprc5a-KO mice and from NNK-induced adenocarcinoma was highly similar to differential expression patterns observed between normal and tumorigenic human lung cells. The NNK-ADC expression signature also separated both mouse and human adenocarcinomas from adjacent normal lung tissues based on publicly available microarray datasets. A key feature of the signature, up-regulation of Ube2c, Mcm2, and Fen1, was validated in mouse normal lung and adenocarcinoma tissues and cells by immunohistochemistry and western blotting, respectively.
Conclusions/significance: Our findings demonstrate that lung tumorigenesis in the Gprc5a-KO mouse model is augmented by NNK and that gene expression changes induced by tobacco carcinogen(s) may be conserved between mouse and human lung epithelial cells. Further experimentation to prove the reliability of the Gprc5a knockout mouse model for the study of tobacco-induced lung carcinogenesis is warranted.
Conflict of interest statement
Figures
Similar articles
-
Development of Kras mutant lung adenocarcinoma in mice with knockout of the airway lineage-specific gene Gprc5a.Int J Cancer. 2017 Oct 15;141(8):1589-1599. doi: 10.1002/ijc.30851. Epub 2017 Jul 17. Int J Cancer. 2017. PMID: 28653505 Free PMC article.
-
Enhancement of lung tumorigenesis in a Gprc5a Knockout mouse by chronic extrinsic airway inflammation.Mol Cancer. 2012 Jan 12;11:4. doi: 10.1186/1476-4598-11-4. Mol Cancer. 2012. PMID: 22239913 Free PMC article.
-
A Gprc5a tumor suppressor loss of expression signature is conserved, prevalent, and associated with survival in human lung adenocarcinomas.Neoplasia. 2010 Jun;12(6):499-505. doi: 10.1593/neo.10390. Neoplasia. 2010. PMID: 20563252 Free PMC article.
-
Understanding tobacco smoke carcinogen NNK and lung tumorigenesis.Int J Oncol. 2006 Oct;29(4):745-52. Int J Oncol. 2006. PMID: 16964372 Review.
-
Tobacco carcinogen NNK-induced lung cancer animal models and associated carcinogenic mechanisms.Acta Biochim Biophys Sin (Shanghai). 2015 Jul;47(7):477-87. doi: 10.1093/abbs/gmv041. Epub 2015 Jun 3. Acta Biochim Biophys Sin (Shanghai). 2015. PMID: 26040315 Review.
Cited by
-
The emerging roles of GPRC5A in diseases.Oncoscience. 2014 Nov 25;1(12):765-76. doi: 10.18632/oncoscience.104. eCollection 2014. Oncoscience. 2014. PMID: 25621293 Free PMC article. Review.
-
Mutation of SMARCA4 Induces Cancer Cell-Intrinsic Defects in the Enhancer Landscape and Resistance to Immunotherapy.Cancer Res. 2025 Jun 2;85(11):1997-2013. doi: 10.1158/0008-5472.CAN-24-2054. Cancer Res. 2025. PMID: 40080526 Free PMC article.
-
Prognostic and clinicopathological significance of GPRC5A in various cancers: A systematic review and meta-analysis.PLoS One. 2021 Mar 31;16(3):e0249040. doi: 10.1371/journal.pone.0249040. eCollection 2021. PLoS One. 2021. PMID: 33788883 Free PMC article.
-
Transcriptomic Alterations in Lung Adenocarcinoma Unveil New Mechanisms Targeted by the TBX2 Subfamily of Tumor Suppressor Genes.Front Oncol. 2018 Oct 30;8:482. doi: 10.3389/fonc.2018.00482. eCollection 2018. Front Oncol. 2018. PMID: 30425966 Free PMC article.
-
Anti-Tumor Effects of Biomimetic Sulfated Glycosaminoglycans on Lung Adenocarcinoma Cells in 2D and 3D In Vitro Models.Molecules. 2020 Jun 3;25(11):2595. doi: 10.3390/molecules25112595. Molecules. 2020. PMID: 32503108 Free PMC article.
References
-
- Jemal A, Siegel R, Ward E, Hao Y, Xu J, et al. Cancer statistics, 2009. CA Cancer J Clin. 2009;59:225–249. - PubMed
-
- Gabrielson E. Worldwide trends in lung cancer pathology. Respirology. 2006;11:533–538. - PubMed
-
- Sun S, Schiller JH, Gazdar AF. Lung cancer in never smokers–a different disease. Nat Rev Cancer. 2007;7:778–790. - PubMed
Publication types
MeSH terms
Substances
Grants and funding
LinkOut - more resources
Full Text Sources
Other Literature Sources
Medical
Molecular Biology Databases
Research Materials
Miscellaneous
