. 2010 Jul 29;6(7):e1001021.
doi: 10.1371/journal.ppat.1001021.

Plasmodium falciparum adhesion on human brain microvascular endothelial cells involves transmigration-like cup formation and induces opening of intercellular junctions

Affiliations

Plasmodium falciparum adhesion on human brain microvascular endothelial cells involves transmigration-like cup formation and induces opening of intercellular junctions

Ronan Jambou et al. PLoS Pathog. .

Abstract

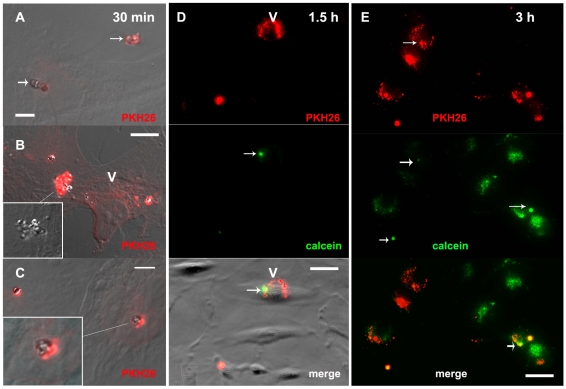
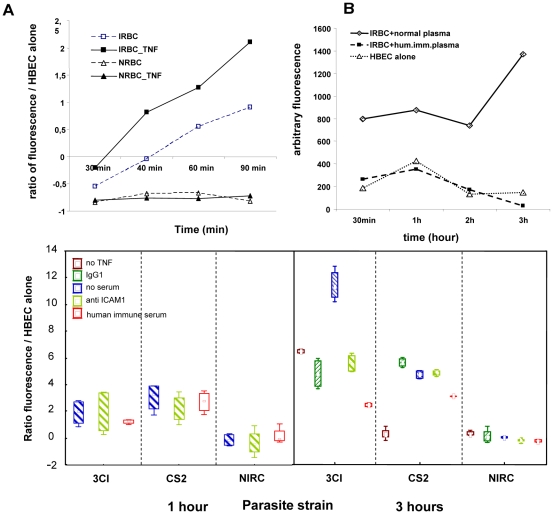
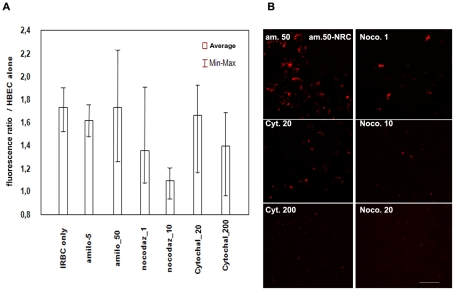
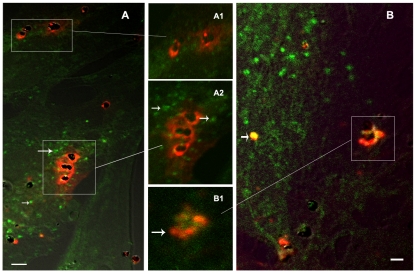
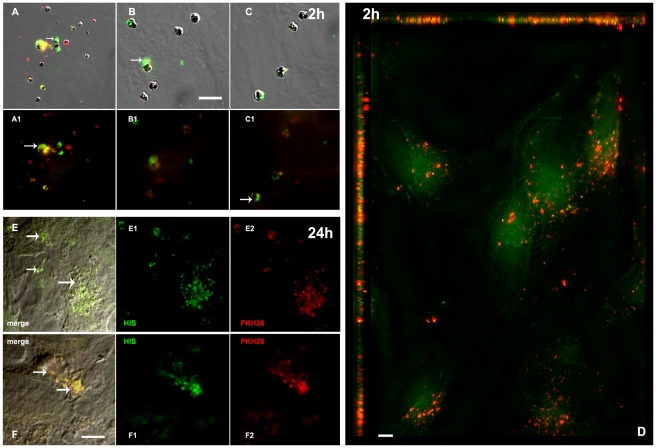
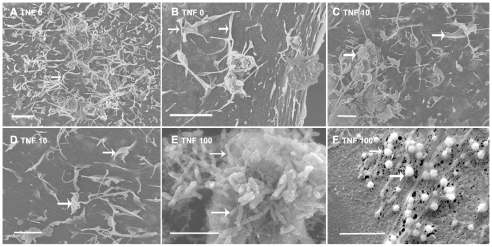
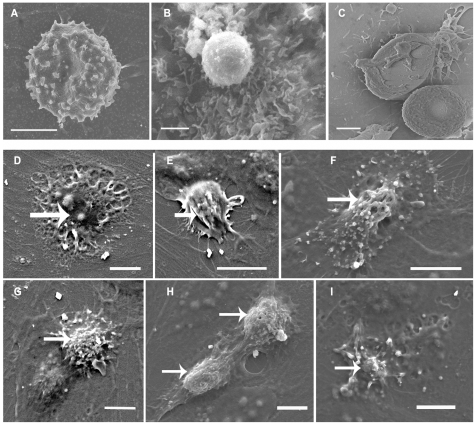
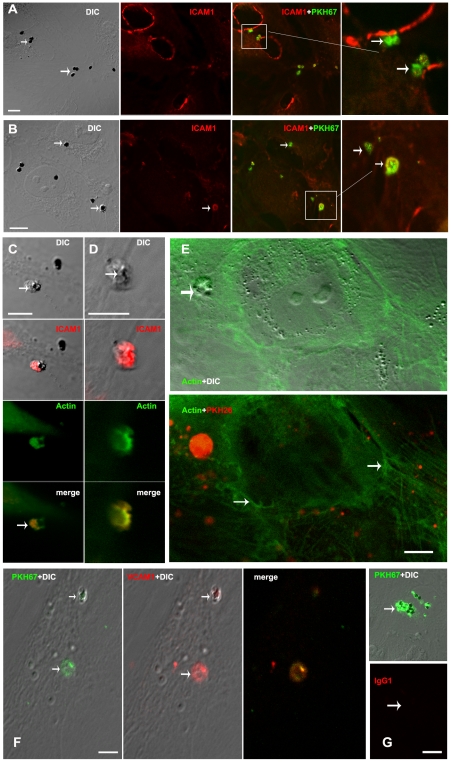
Cerebral malaria, a major cause of death during malaria infection, is characterised by the sequestration of infected red blood cells (IRBC) in brain microvessels. Most of the molecules implicated in the adhesion of IRBC on endothelial cells (EC) are already described; however, the structure of the IRBC/EC junction and the impact of this adhesion on the EC are poorly understood. We analysed this interaction using human brain microvascular EC monolayers co-cultured with IRBC. Our study demonstrates the transfer of material from the IRBC to the brain EC plasma membrane in a trogocytosis-like process, followed by a TNF-enhanced IRBC engulfing process. Upon IRBC/EC binding, parasite antigens are transferred to early endosomes in the EC, in a cytoskeleton-dependent process. This is associated with the opening of the intercellular junctions. The transfer of IRBC antigens can thus transform EC into a target for the immune response and contribute to the profound EC alterations, including peri-vascular oedema, associated with cerebral malaria.


Conflict of interest statement

The authors have declared that no competing interests exist.

Figures

Figure 1
Figure 1. Transfer of material from IRBC to HBEC.
Aspects of the HBEC-D3 monolayer after incubation with IRBC (3Ci strain) for 30 min (A–C), 1.5 h (D) or 3 h (E). Prior to co-culture, plasma membranes of the IRBC were labelled with PKH-26 (red) and cytoplasm with calcein (green). IRBC were added at a ratio of 20:1 i.e. 2 106 IRBC per well of 24 wells plate. HBEC monolayers were examined by fluorescence microscopy at magnification 600 after fixation labelling and mounting as described. For A-B-C-D fluorescence and DIC pictures are merge to show HBED-D3 (V) and IRBC (arrow), except for insert 1B where only DIC is shown to visualize IRBC packed in an engulfing cup. Bar: 10 µm (A–C), 20 µM (D–F); (V) HBED-D3, (arrow) IRBC. Panels A to C show an early trogocytosis- like transfer of dye from the IRBC membrane onto the HBEC surface which appears as diffusion of red around the IRBC (arrows and insert 1C); in D, after 1.5 h of co-culture PKH26 is transferred in the HBEC (V) far from the IRBC still identified within the HBEC as green elements; a remaining normal red cell (PHK-26 labelled but poorly calcein-labelled) can be seen in the lower corner (arrow). E: show diffusion of the calcein in the HBEC after 3 h of culture with some remaining IRBC cytoplasm identified as green dots (arrow).
Figure 2
Figure 2. Quantification of the transfer of dye from PKH-labelled IRBC to HBECs during co-culture.
HBECs D3 were grown to confluence in 24 wells plate, incubated overnight with 10ng/ml of TNF (except for control labelled “no TNF”) and co-cultured with PKH67-labelled IRBC for 30min to 3h before processing. Quantification of the fluorescence transferred from IRBC to HBECs was performed using an Optima Fluostar. Each figure summarizes four experiments (in triplicates). A) time dependent transfer of dye to the HBECs. IRBCs are incubated without (“IRBC”) or with (“IRBC-TNF”) previous activation of the cells with TNF, to highlight the effect of TFN on the increase of adhesion and transfer of dye; non infected red blood cells (NRBC) are incubated in the same conditions as control; fluorescence transfer was expressed as the ratio of fluorescence of the HBEC monolayer alone [(HBEC+IRBC−HBEC_alone)/HBEC_alone]. B) Effect of immune plasma on the time dependent transfer of dye to the HBECs. Control consists of HBECs incubated without IRBCs. It shows that pre-incubation of the IRBCs with immune (but not with non-immune) plasma inhibits adhesion of IRBC to the HBECs. C) shows effect of incubation of IRBCs with serums before co-culture with HBECs on the transfer of dye. “control” is incubation with “no-serum”. Immune plasma used had a strong effect (50%) on adhesion after 1 h or 3 h of co-culture. Anti-ICAM1 (5 µg/ml) had a clear but mild effect (25%) on adhesion of 3CI (selected to stick to ICAM1) but none on adhesion of CS2 (selected to stick to chondroitine sulphate). Anti-VCAM1 had rather no effect on the adhesion of the IRBC (not shown).
Figure 3
Figure 3. Effect of cytoskeleton inhibitors on the transfer of the membrane dye from IRBC to HBECs.
Aspect of the HBEC-D3 monolayer after incubation with PHK67-labelled IRBCs (3Ci) for 3 h in the presence of various concentrations of inhibitors (nocodazole 1-10-20 µM; cytochalasine D 20–200 µM; Amiloride 5–50µM). Cultures were conducted in 24 well plates in standard conditions. A) Quantification of the fluorescence transferred from IRBC to the HBEC using an Optima Fluostar. For each concentration of inhibitors, fluorescence ratio was calculated as: (HBEC IRBC−HBEC alone)/HBEC alone); experiment was done 4 times in triplicates. B) Visualisation of the same HBEC monolayers prior to fluorescence quantification in Optima, with a Fluorescence Olympus IX71 (magnification 400) Bar: 100 µm.
Figure 4
Figure 4. Transfer of material from IRBC membrane to HBEC early endosomes.
After 1 or 3 h of co-culture, IRBC (3Ci) membrane components (red PKH26 labelling) are transferred to HBEC-D3 and partially to early endosomes (green anti-EEA1 labelling). HBEC-D3 monolayers are visualised after fixation, permeabilization, labelling and mounting as described. Hemozoin appears as black dots in the middle of IRBCs. Bar: 20 µm (A), 10 µM (B). A1 and B1-B2 are higher magnification of A and B, respectively. A) 1h incubation, trogocytosis like diffusion of PKH26 form IRBC on the HBECs membranes is still visible but no transfer of PKH26 was detected in the EE (arrow); B) after 3h of co-culture, PKH26 (red) from IRBC is partially transferred to EE (green) and merges as yellow labelling (arrow).
Figure 5
Figure 5. Transfer of malaria antigens to HBECs during co-culture with IRBCs.
Figure shows HBEC surface with attached IRBC and diffusion of dye on the surface. PKH26(red)-labelled IRBCs (3Ci) were incubated with HBEC-D3 monolayers for 2h (A–D) and removed before an additional overnight culture of the cells (E–F). After fixation of IRBC and permeabilization of the cells, malaria antigens are detected using a pool of human immune serum from Senegalese patients (HIS),.. Remaining IRBCs appeared as yellow. HBEC monolayers are visualised with Olympus IX71 at magnification 1000 (A–C) or 600 (D–F). DIC and fluorescence are merged for A-B-C-E-F; only fluorescence is shown in A1-B1-C1, E1-2 and F1-2; Bar: 20µm (A–C), 50µM (D–F). A–C) early diffusion of malaria antigens (green and arrow) onto the surface of HBECs around the IRBC (arrow). PKH-labelled compounds and malaria antigens migrated mostly separately. IRBC themselves can be seen as yellow spots prior diffusion of compounds. D) 2D-reconstruction after deconvolution analysis of z-stacks. Nearest neighbour deconvolution analysis was applied onto 20 sections of 0.5 µm to generate 2D view. IRBC PKH-labelled (red) membrane lipids clearly diffused separately from antigenic compounds (green); upper and left bar show reconstitution of section of HBECs and highlight separate diffusion of red and green in the HBECs. A slight green labeling can be seen on the HBEC membrane may be due to other antigenic malarial components, possible including soluble components released from IRBC during incubation and covering HBEC surface. E–F) Persistence of malaria antigens and PKH-26: malaria antigens (green) and IRBC membrane compounds (red) are detected in the HBECs after an additional overnight incubation of the cells. (yellow merge colour) ). The labelling can only be seen after permeabilization of the HBEC which supports an intracellular localisation of the malaria antigens in vesicular structures (arrow).
Figure 6
Figure 6. Scanning electron microscopy of HBECs monolayers.
HBECs 5i were grown to confluence and incubated overnight with 10 ng/ml (C–D) or 100 ng/ml (E–F) TNF, or without TNF before processing (see M&M) and observed with a Philips XL30 at 10 kV. Bar: 2 µm. A–B) show digitations and podocytes (arrow) on the surface of HBECs, B–C) show leaf-like enlargement of the digitations (arrow), E–F) show enlargement of the digitations (arrow) and production of microparticles (arrow).
Figure 7
Figure 7. Scanning electromicroscopy of HBECs monolayers incubated with IRBC.
HBECs-5i (B–C) and D3 (A, D–I) were grown to confluence on coverslides, incubated overnight with 10ng/ml of TNF and incubated with IRBC (3Ci) for 40 min (A–C) or 90 min (D–I) before processing and observation with a Philips XL30 at 10 kV. A–C) show aspects of the first step of adhesion of IRBCs onto HBECs with (B–C) or without (A) microvilli. D–I) show the engulfing process of IRBC with development of fillipods (D), formation of the cup (E) , and engulfing (F–I). (arrow, engulfing structure) Bar: 2 µm (A–B), 10 µm (D–I).
Figure 8
Figure 8. Involvement of ICAM-1, actin and VCAM-1 in the binding of IRBCs on HBECs.
HBECs D3 were grown to confluence, incubated overnight with 10 ng/ml TNF and co-cultured with IRBCs for 90 min before processing and labelling with anti-ICAM-1, phalloidin or anti-VCAM-1.. Bar: 20µm (A, B, E–G), 10µm (C–D). A–B) show PKH-labelled IRBC stacked onto the HBECs and colocalized with ICAM-1 labelling. ICAM-1 was both detected on the surface of the HBECs and in the engulfing cup of the IRBCs, C–D) show engulfment of an IRBC by HBEC. ICAM-1 and actin are co-localized in the engulfing cup (arrow). E) shows stress actin fibres in HBECs (arrow) and accumulation of actin in the engulfing cup (arrow) of PKH-labelled IRBCs. F) same as A–B but with VCAM1 detection in the engulfing cup (arrow). G) same as A–B with control mouse IgG1 isotype labelling showing no signal.
Figure 9
Figure 9. Measurement of the impedance of the HBEC monolayers during coculture with IRBC.
Opening of the intercellular junctions was estimated by dynamic measurement of the impedance of the monolayer every 10 min for 24 h after the beginning of the co-culture on an ECIS instrument. HBEC monolayers are grown to confluence and co-cultured with IRBC (3Ci- or CS2) or NRBC. Red blood cells were removed from the HBECs by gentle wash, 4 hours after beginning of incubation. All the monolayers are incubated with 10 ng/ml of TNF prior commencement of the co-culture with no effect on the impedance (see Controls). Experiments were done more than 10 times but only illustrative curves are shown.. Nocodazole (10 µM), rolipram (10 µM) or anti-ICAM-1 (5 µg/ml) were added 30min prior beginning of the co-culture and let in the medium during all the time. TNF (100 ng/ml) and Histamine (100 µM) were used as positive control to induce opening of the junction. A) show decrease of impedance when HBEC monolayer is co-cultured with IRBC(3Ci) or IRBC(3Ci)+NRBC (vol/vol), but not when co-cultured with normal RBC). Impedance is related to parasiteamia as the effect is less when IRBC are diluted with NRBC; B) decrease of impedance when HBEC monolayer is co-cultured with IRBC(3Ci) but not with IRBC(CS2) which do not bind tightly to HBECs; C) inhibition of the IRBC(3Ci) effect on impedance by previous incubation of the monolayer with nocodazole; D) absence of inhibitory effect of rolipram on impedance in the same setting as C); E) absence of inhibitory effect of anti-ICAM1 on impedance in the same setting as C).

Similar articles

Cited by

References

    1. WHO. 2008. World malaria report 2008. www.who.org.
    1. Newton CR, Warn PA, Winstanley PA, Peshu N, Snow RW, et al. Severe anaemia in children living in a malaria endemic area of Kenya. Trop Med Int Health. 1997;2:165–178. - PubMed
    1. Adibhatla RM, Hatcher JF. Phospholipase A(2), reactive oxygen species, and lipid peroxidation in CNS pathologies. BMB. 2008;41:560–567. - PMC - PubMed
    1. Deininger MH, Kremsner PG, Meyermann R, Schluesener HJ. Focal accumulation of cyclooxygenase-1 (COX-1) and COX-2 expressing cells in cerebral malaria. J Neuroimmunol. 2000;106:198–205. - PubMed
    1. Saavedra-Lozano J, Booth TN, Weprin BE, Ramilo O. Isolated cerebellar edema and obstructive hydrocephalus in a child with cerebral malaria. Pediatr Infect Dis. 2001;20:908–911. - PubMed

Publication types

Substances