Breast cancer DNA methylation profiles are associated with tumor size and alcohol and folate intake
- PMID: 20686660
- PMCID: PMC2912395
- DOI: 10.1371/journal.pgen.1001043
Breast cancer DNA methylation profiles are associated with tumor size and alcohol and folate intake
Abstract
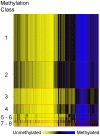
Although tumor size and lymph node involvement are the current cornerstones of breast cancer prognosis, they have not been extensively explored in relation to tumor methylation attributes in conjunction with other tumor and patient dietary and hormonal characteristics. Using primary breast tumors from 162 (AJCC stage I-IV) women from the Kaiser Division of Research Pathways Study and the Illumina GoldenGate methylation bead-array platform, we measured 1,413 autosomal CpG loci associated with 773 cancer-related genes and validated select CpG loci with Sequenom EpiTYPER. Tumor grade, size, estrogen and progesterone receptor status, and triple negative status were significantly (Q-values <0.05) associated with altered methylation of 209, 74, 183, 69, and 130 loci, respectively. Unsupervised clustering, using a recursively partitioned mixture model (RPMM), of all autosomal CpG loci revealed eight distinct methylation classes. Methylation class membership was significantly associated with patient race (P<0.02) and tumor size (P<0.001) in univariate tests. Using multinomial logistic regression to adjust for potential confounders, patient age and tumor size, as well as known disease risk factors of alcohol intake and total dietary folate, were all significantly (P<0.0001) associated with methylation class membership. Breast cancer prognostic characteristics and risk-related exposures appear to be associated with gene-specific tumor methylation, as well as overall methylation patterns.
Conflict of interest statement
The authors have declared that no competing interests exist.
Figures


Similar articles
-
Association of leukocyte DNA methylation changes with dietary folate and alcohol intake in the EPIC study.Clin Epigenetics. 2019 Apr 2;11(1):57. doi: 10.1186/s13148-019-0637-x. Clin Epigenetics. 2019. PMID: 30940212 Free PMC article.
-
Interaction of dietary folate intake, alcohol, and risk of hormone receptor-defined breast cancer in a prospective study of postmenopausal women.Cancer Epidemiol Biomarkers Prev. 2002 Oct;11(10 Pt 1):1104-7. Cancer Epidemiol Biomarkers Prev. 2002. PMID: 12376515
-
Alcohol and dietary folate intake and the risk of breast cancer: a case-control study in Japan.Eur J Cancer Prev. 2013 Jul;22(4):358-66. doi: 10.1097/CEJ.0b013e32835b6a60. Eur J Cancer Prev. 2013. PMID: 23183091
-
CpG island methylation profile of estrogen receptor alpha in Iranian females with triple negative or non-triple negative breast cancer: new marker of poor prognosis.Asian Pac J Cancer Prev. 2012;13(2):451-7. doi: 10.7314/apjcp.2012.13.2.451. Asian Pac J Cancer Prev. 2012. PMID: 22524805
-
Prognostic DNA methylation markers for hormone receptor breast cancer: a systematic review.Breast Cancer Res. 2020 Jan 31;22(1):13. doi: 10.1186/s13058-020-1250-9. Breast Cancer Res. 2020. PMID: 32005275 Free PMC article.
Cited by
-
Genome methylation patterns in male breast cancer - Identification of an epitype with hypermethylation of polycomb target genes.Mol Oncol. 2015 Oct;9(8):1565-79. doi: 10.1016/j.molonc.2015.04.013. Epub 2015 May 8. Mol Oncol. 2015. PMID: 25990542 Free PMC article.
-
Age-related DNA methylation in normal breast tissue and its relationship with invasive breast tumor methylation.Epigenetics. 2014 Feb;9(2):268-75. doi: 10.4161/epi.27015. Epub 2013 Nov 6. Epigenetics. 2014. PMID: 24196486 Free PMC article.
-
Black-White Disparities in Breast Cancer Subtype: The Intersection of Socially Patterned Stress and Genetic Expression.AIMS Public Health. 2017;4(5):526-556. doi: 10.3934/publichealth.2017.5.526. Epub 2017 Nov 24. AIMS Public Health. 2017. PMID: 29333472 Free PMC article.
-
Normal breast tissue DNA methylation differences at regulatory elements are associated with the cancer risk factor age.Breast Cancer Res. 2017 Jul 10;19(1):81. doi: 10.1186/s13058-017-0873-y. Breast Cancer Res. 2017. PMID: 28693600 Free PMC article.
-
Integrated approach of nutritional and molecular epidemiology, mineralogical and chemical pollutant characterisation: the protocol of a cross-sectional study in women.BMJ Open. 2017 Apr 4;7(4):e014756. doi: 10.1136/bmjopen-2016-014756. BMJ Open. 2017. PMID: 28377395 Free PMC article.
References
-
- Atlanta: American Cancer Society; 2007. Global Cancer Facts & Figures 2007.
-
- Atlanta: American Cancer Society; 2009. Breast Cancer Facts & Figures 2009–2010.
-
- Singletary SE, Connolly JL. Breast cancer staging: working with the sixth edition of the AJCC Cancer Staging Manual. CA Cancer J Clin. 2006;56:37–47; quiz 50–31. - PubMed
-
- Edge SB, Byrd DR, Compton CC, Fritz AG, Green FL, et al. AJCC Cancer Staging Atlas: Springer. 2009.
-
- McGuire WL. Steroid receptors in human breast cancer. Cancer Res. 1978;38:4289–4291. - PubMed
Publication types
MeSH terms
Substances
Grants and funding
- R01CA126831/CA/NCI NIH HHS/United States
- R01 ES006717/ES/NIEHS NIH HHS/United States
- R01CA078609/CA/NCI NIH HHS/United States
- R01CA100679/CA/NCI NIH HHS/United States
- R01CA121147/CA/NCI NIH HHS/United States
- P50 CA097257/CA/NCI NIH HHS/United States
- R01ES06717/ES/NIEHS NIH HHS/United States
- R01CA105274/CA/NCI NIH HHS/United States
- R01 CA126939/CA/NCI NIH HHS/United States
- R01 CA082354/CA/NCI NIH HHS/United States
- R01 CA052689/CA/NCI NIH HHS/United States
- R01 CA126831/CA/NCI NIH HHS/United States
- R01 CA105274/CA/NCI NIH HHS/United States
- R01 CA078609/CA/NCI NIH HHS/United States
- R01 CA121147/CA/NCI NIH HHS/United States
- P01ES018172/ES/NIEHS NIH HHS/United States
- P01 ES018172/ES/NIEHS NIH HHS/United States
- P50CA097257/CA/NCI NIH HHS/United States
- R01CA126939/CA/NCI NIH HHS/United States
- R01 CA100679/CA/NCI NIH HHS/United States
- R01CA52689/CA/NCI NIH HHS/United States
LinkOut - more resources
Full Text Sources
Medical
Molecular Biology Databases
Research Materials

