. 2010 Jul 29;6(7):e1001025.
doi: 10.1371/journal.ppat.1001025.

The role of coupled positive feedback in the expression of the SPI1 type three secretion system in Salmonella

Affiliations

The role of coupled positive feedback in the expression of the SPI1 type three secretion system in Salmonella

Supreet Saini et al. PLoS Pathog. .

Erratum in

Abstract

Salmonella enterica serovar Typhimurium is a common food-borne pathogen that induces inflammatory diarrhea and invades intestinal epithelial cells using a type three secretion system (T3SS) encoded within Salmonella pathogenicity island 1 (SPI1). The genes encoding the SPI1 T3SS are tightly regulated by a network of interacting transcriptional regulators involving three coupled positive feedback loops. While the core architecture of the SPI1 gene circuit has been determined, the relative roles of these interacting regulators and associated feedback loops are still unknown. To determine the function of this circuit, we measured gene expression dynamics at both population and single-cell resolution in a number of SPI1 regulatory mutants. Using these data, we constructed a mathematical model of the SPI1 gene circuit. Analysis of the model predicted that the circuit serves two functions. The first is to place a threshold on SPI1 activation, ensuring that the genes encoding the T3SS are expressed only in response to the appropriate combination of environmental and cellular cues. The second is to amplify SPI1 gene expression. To experimentally test these predictions, we rewired the SPI1 genetic circuit by changing its regulatory architecture. This enabled us to directly test our predictions regarding the function of the circuit by varying the strength and dynamics of the activating signal. Collectively, our experimental and computational results enable us to deconstruct this complex circuit and determine the role of its individual components in regulating SPI1 gene expression dynamics.


Conflict of interest statement

The authors have declared that no competing interests exist.

Figures

Figure 1
Figure 1. SPI1 gene expression is hierarchical and exhibits a switch-like transition from the “off” to the “on” state.
(A) Diagram of the SPI1 gene circuit. HilA is the master SPI1 regulator as it activates the expression of the genes encoding the T3SS. HilA, in turn, is regulated by HilC, HilD, and RtsA. These three regulators can independently activate HilA expression. They can also activate their own expression and that of each other's. HilE represses the activity of HilD by binding to it and preventing it from activating its target promoters. (B) Time-course dynamics of PhilD (pSS074), PhilC (pSS075), PrtsA (pSS076), and PhilA (pSS077) promoter activities in wild-type cells as determined using luciferase transcriptional reporters. To induce SPI1 gene expression, cells were first grown overnight in LB/no salt and then sub-cultured into fresh LB/1% NaCl conditions to an OD of 0.05 and grown statically. Luminescence values were normalized with the OD600 absorbance to account for cell density. Average promoter activities from three independent experiments on separate days are reported. For each experiment, six samples were tested. Error-bars indicate standard deviation. (C) Dynamics of PhilA (pSS055) promoter activity in wild-type cells as determined using green fluorescent protein (GFP) transcriptional fusions and flow cytometry. The SPI1 gene expression was induced as described above. Samples were collected at the indicated times and arrested in their respective state by adding chloramphenicol. Approximately 30,000 cell measurements were used to construct each histogram. As a control, we expressed GFP from a constitutive promoter and observed continuous, rheostatic-like expression dynamics and a homogenous response in the population (Figure S1E). Strain genotypes and plasmid descriptions are provided in Tables 1 and 2 .
Figure 2
Figure 2. SPI1 gene expression is induced by a step increase in PhilD promoter activity.
(A) Comparison of time-course dynamics for PhilD (pSS074) promoter activities in wild type (black) and a ΔhilD mutant (JS253, red) as determined using luciferase transcriptional reporters. (B) Comparison of PhilD (pSS072) promoter activity in wild type (black) and a ΔhilD mutant (JS253, grey) as determined using GFP transcriptional reporters and flow cytometry. Note that the activation of the PhilD promoter is switch-like both in wild type and the ΔhilD mutant. Experiments were performed as described in Figure 1 .
Figure 3
Figure 3. HilC and RtsA amplify SPI1 gene expression.
(A) Comparison of time-course dynamics for PhilD (pSS074, black) and PhilA (pSS077, red) promoter activities in wild type (solid lines) and a ΔhilC ΔrtsA mutant (CR350, dashed lines) as determined using luciferase transcriptional reporters. (B and C) Comparison of PhilA (pSS055, B) and PhilD (pSS072, C) promoter activities in wild type (black) and a ΔhilC ΔrtsA mutant (CR350, grey) as determined using GFP transcriptional reporters and flow cytometry. Note that the loss of HilC and RtsA causes both a delay and decrease in PhilA promoter activity whereas it causes only a decrease in activity in the case of the PhilD promoter. Experiments were performed as described in Figure 1 .
Figure 4
Figure 4. HilE dampens SPI1 gene expression.
(A) Comparison of time-course dynamics for PhilD (pSS074, black) and PhilA (pSS077, red) promoter activities in wild type (solid lines) and a ΔhilE mutant (CR361, dashed lines) as determined using luciferase transcriptional reporters. (B) Comparison of PhilA (pSS055) promoter activities in wild type (black) and a ΔhilE mutant (CR361, grey) as determined using GFP transcriptional reporters and flow cytometry. Similar results are also observed with the PhilD promoter, though the phenotypic effect is much larger (Figure S4). Experiments were performed as described in Figure 1 .
Figure 5
Figure 5. Mathematical model is able to accurately capture SPI1 gene expression dynamics both for wild type and key mutants.
(A) Time-course simulation of HilD, HilC, RtsA, and HilA expression dynamics in wild-type cells. These results are the average of 1000 simulations. These simulations are meant to capture the population-level behavior of the circuit. (B) Time-course simulation of HilA expression at single-cell resolution. The expression values are normalized to one and plotted on a log scale. The expression values are given in relative log units (R.L.U.). Similar expression dynamics are also seen for HilD, HilC, and RtsA (see Matlab code provided as supplementary material). (C) Same results provided as a two-dimension heat plot, where the color intensity denotes the density of events. Note that the model captures the transient heterogeneity observed in our flow cytometry data where cells in both the “off” and “on” states are found at intermediate times. Panels A–C were generated from the same set of simulation runs. (D and E) Time-course simulation of HilD (D) and HilA (E) expression dynamics in wild type and ΔhilD, ΔhilC ΔrtsA, and ΔhilE mutants at population resolution. The results for each mutant were obtained from the average of 1000 simulations. Similar behavior is also seen at single-cell resolution. Mutants were simulated by setting the activity of the respective gene to zero in the model. A detailed description of the model is provided in the Materials and Methods.
Figure 6
Figure 6. Parametric analysis of model predicts that SPI1 gene circuit functions as an amplifier and encodes an activation threshold.
(A) Effect of positive feedback on HilD expression. Plot shows steady-state concentration of HilD as a function of the parameters formula image and formula image. The parameter formula image 
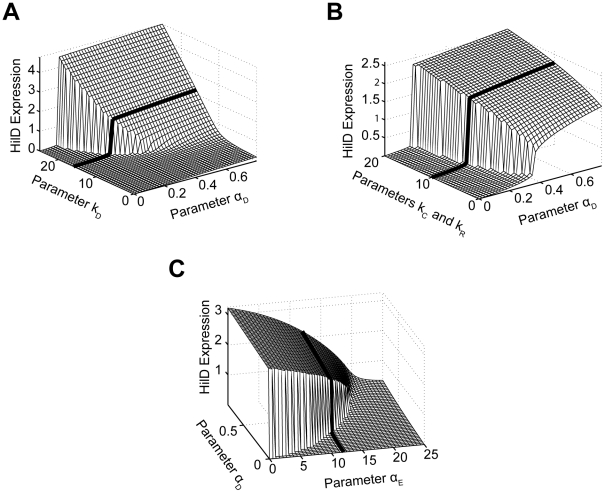
specifies the degree by which the SPI1 regulators - HilC, HilD, and RtsA - can activate HilD expression, effectively the strength of positive feedback on HilD expression. The parameter formula image specifies the strength of the signal activating HilD expression. (B) Effect of HilC and RtsA on HilD expression. Plot shows the steady-state concentration of HilD as a function of the parameters formula image, formula image, and formula image. The parameters formula image and formula image specify the degree by which the SPI1 regulators - HilC, HilD, and RtsA - can activate HilC and RtsA expression, respectively. In other words, these parameters set the strength of feedback on HilC and RtsA expression. In these simulations, the parameters formula image and formula image were both varied in tandem: the numerical values for the two are the same. (C) Effect of HilE on HilD expression. Plot shows the steady-state concentration of HilD as a function of the parameters formula image and formula image. The parameter formula image specifies the rate of HilE expression. Results for HilA are shown in Figures S6A–C. The black lines in the plots are used to denote the results obtained using the nominal parameters (aside from formula image). A detailed description of the model is provided in the Materials and Methods.
Figure 7
Figure 7. Rewiring SPI1 gene circuits demonstrates that HilE imposes threshold on activation.
(A) Comparison of time-course dynamics for PhilA (pSS077) promoter activities in wild type (black), CR355 (ΔPhilD::PhilC ΔhilC, red) and CR356 (ΔPhilD::PhilC ΔhilC ΔhilE, blue) as determined using luciferase transcriptional reporters. In strain CR355, the PhilD promoter was replaced with the PhilC promoter in an otherwise ΔhilC background. In this strain, hilD is transcriptionally regulated in a manner identical to hilC. Strain CR356 is the same as CR355 except that it lacks HilE. (B) Dynamics of PhilA promoter activity in CR356 as determined using green fluorescent protein (GFP) transcriptional fusions and flow cytometry. Note that the activation of the PhilA promoter in CR356 is no longer switch-like but rather rheostatic in nature. Similar dynamics are seen with the PhilC promoter (Figure S2C). Experiments were performed as described in Figure 1 .

Similar articles

Cited by

References

    1. Ellermeier CD, Slauch JM. The genus Salmonella. In: Dworkin M, Falkow S, Rosenberg E, Schleifer K-H, Stackebrandt E, editors. The prokaryotes, 3rd ed. New York, NY.: Springer; 2006. pp. 123–158.
    1. Miller SI, Pegues PA. Salmonella species, including Salmonella typhi. In: Bennett JE, Dolin R, editors. Principles of infectious diseases. Philadelphia PA: Churchill Livingstone; 2000. pp. 2344–2363.
    1. Mills DM, Bajaj V, Lee CA. A 40 kb chromosomal fragment encoding Salmonella typhimurium invasion genes is absent from the corresponding region of the Escherichia coli K-12 chromosome. Mol Microbiol. 1995;15:749–759. - PubMed
    1. Lee CA, Jones BD, Falkow S. Identification of a Salmonella typhimurium invasion locus by selection for hyperinvasive mutants. Proc Natl Acad Sci U S A. 1992;89:1847–1851. - PMC - PubMed
    1. Kimbrough TG, Miller SI. Contribution of Salmonella typhimurium type III secretion components to needle complex formation. Proc Natl Acad Sci U S A. 2000;97:11008–11013. - PMC - PubMed

Publication types

MeSH terms

Substances