

A comprehensive, quantitative, and genome-wide model of translation
- PMID: 20686685
- PMCID: PMC2912337
- DOI: 10.1371/journal.pcbi.1000865
A comprehensive, quantitative, and genome-wide model of translation
Abstract
Translation is still poorly characterised at the level of individual proteins and its role in regulation of gene expression has been constantly underestimated. To better understand the process of protein synthesis we developed a comprehensive and quantitative model of translation, characterising protein synthesis separately for individual genes. The main advantage of the model is that basing it on only a few datasets and general assumptions allows the calculation of many important translational parameters, which are extremely difficult to measure experimentally. In the model, each gene is attributed with a set of translational parameters, namely the absolute number of transcripts, ribosome density, mean codon translation time, total transcript translation time, total time required for translation initiation and elongation, translation initiation rate, mean mRNA lifetime, and absolute number of proteins produced by gene transcripts. Most parameters were calculated based on only one experimental dataset of genome-wide ribosome profiling. The model was implemented in Saccharomyces cerevisiae, and its results were compared with available data, yielding reasonably good correlations. The calculated coefficients were used to perform a global analysis of translation in yeast, revealing some interesting aspects of the process. We have shown that two commonly used measures of translation efficiency - ribosome density and number of protein molecules produced - are affected by two distinct factors. High values of both measures are caused, i.a., by very short times of translation initiation, however, the origins of initiation time reduction are completely different in both cases. The model is universal and can be applied to any organism, if the necessary input data are available. The model allows us to better integrate transcriptomic and proteomic data. A few other possibilities of the model utilisation are discussed concerning the example of the yeast system.
Conflict of interest statement
The authors have declared that no competing interests exist.
Figures
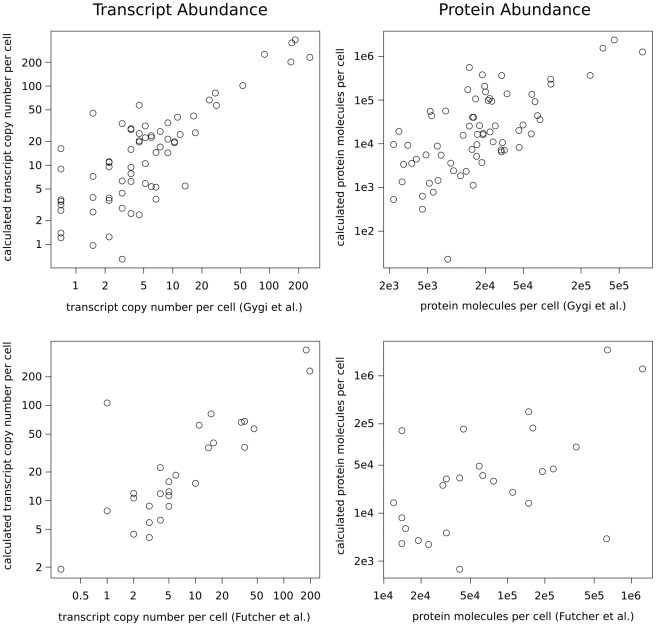
 (left) and
  (right) with experimentally determined mRNA and protein abundances by two independent studies , . The axes were log transformed. Calculated
  values are presented in Table 2. The distribution of the log-fold differences of the mRNA and protein concentrations reported by the model and reference studies are presented in Supplementary Figure S1.
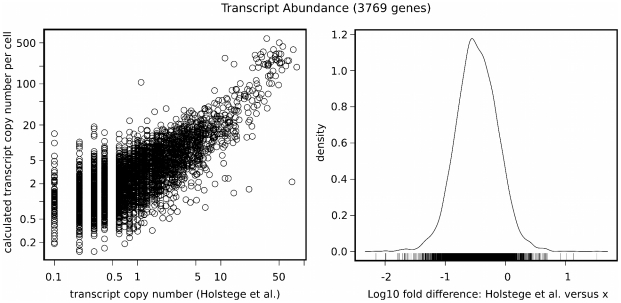
 with mRNA abundances determined by high-density oligonucleotide array (HDA) experiment . The axes were log transformed. Calculated
  value for the comparison is presented in Table 2. Right plot: distribution of the log-fold differences of the mRNA concentrations reported by the model and reference study.
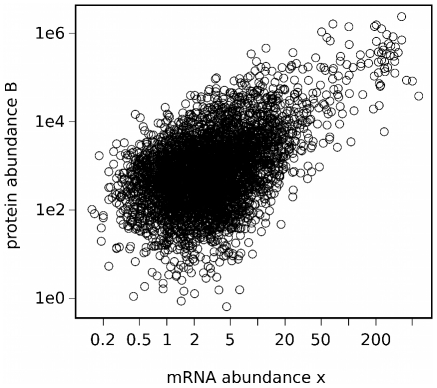
 ) and the number of protein molecules produced from a given gene (parameter
  ). We performed linear regression through the origin on log transformed data. Adjusted
  value calculated over the entire dataset (4192 genes of known
  ) was 0.59. This means that over 40% (in log space) of the variation in protein abundance cannot be explained by variation in mRNA abundance, suggesting some additional, posttranscriptional mechanisms of gene expression regulation.
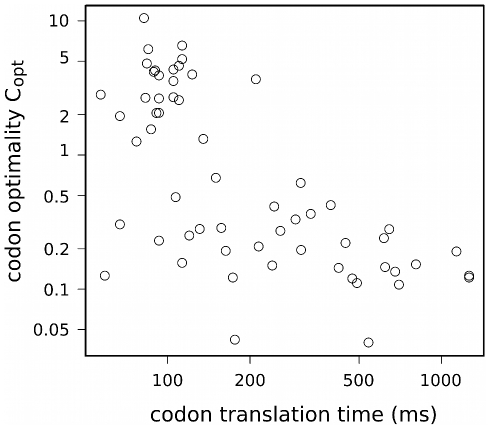
 C of individual yeast codons with codon optimality values
  calculated by . There is negative correlation between
  value and translation time of a codon. However, while optimal codons (high
  values) have only short times of translation, non-optimal codons may be translated at both high and low rates. Adjusted
  value obtained in linear regression model through the origin on log transformed values indicates, that translation speed may explain only 15% of variability in
  values.
Similar articles
-
Inferring efficiency of translation initiation and elongation from ribosome profiling.Nucleic Acids Res. 2020 Sep 25;48(17):9478-9490. doi: 10.1093/nar/gkaa678. Nucleic Acids Res. 2020. PMID: 32821926 Free PMC article.
-
Full-length ribosome density prediction by a multi-input and multi-output model.PLoS Comput Biol. 2021 Mar 26;17(3):e1008842. doi: 10.1371/journal.pcbi.1008842. eCollection 2021 Mar. PLoS Comput Biol. 2021. PMID: 33770074 Free PMC article.
-
Unbiased Quantitative Models of Protein Translation Derived from Ribosome Profiling Data.PLoS Comput Biol. 2015 Aug 14;11(8):e1004336. doi: 10.1371/journal.pcbi.1004336. eCollection 2015 Aug. PLoS Comput Biol. 2015. PMID: 26275099 Free PMC article.
-
Recent advances in ribosome profiling for deciphering translational regulation.Methods. 2020 Apr 1;176:46-54. doi: 10.1016/j.ymeth.2019.05.011. Epub 2019 May 17. Methods. 2020. PMID: 31103613 Review.
-
The ribosome in action: Tuning of translational efficiency and protein folding.Protein Sci. 2016 Aug;25(8):1390-406. doi: 10.1002/pro.2950. Epub 2016 Jun 8. Protein Sci. 2016. PMID: 27198711 Free PMC article. Review.
Cited by
-
Estimating Total Quantitative Protein Content in Escherichia coli, Saccharomyces cerevisiae, and HeLa Cells.Int J Mol Sci. 2023 Jan 20;24(3):2081. doi: 10.3390/ijms24032081. Int J Mol Sci. 2023. PMID: 36768409 Free PMC article.
-
An optimal regulation of fluxes dictates microbial growth in and out of steady state.Elife. 2023 Mar 10;12:e84878. doi: 10.7554/eLife.84878. Elife. 2023. PMID: 36896805 Free PMC article.
-
Ribosome Elongation Kinetics of Consecutively Charged Residues Are Coupled to Electrostatic Force.Biochemistry. 2021 Nov 2;60(43):3223-3235. doi: 10.1021/acs.biochem.1c00507. Epub 2021 Oct 15. Biochemistry. 2021. PMID: 34652913 Free PMC article.
-
Quantifying negative feedback regulation by micro-RNAs.Phys Biol. 2011 Oct;8(5):055002. doi: 10.1088/1478-3975/8/5/055002. Epub 2011 Aug 10. Phys Biol. 2011. PMID: 21832809 Free PMC article.
-
Rate-limiting steps in yeast protein translation.Cell. 2013 Jun 20;153(7):1589-601. doi: 10.1016/j.cell.2013.05.049. Cell. 2013. PMID: 23791185 Free PMC article.
References
-
- Kochetov AV, Kolchanov NA, Sarai A. Interrelations between the efficiency of translation start sites and other sequence features of yeast mRNAs. Mol Genet Genomics. 2003;270:442–7. - PubMed
-
- Kozak M. Structural features in eukaryotic mRNAs that modulate the initiation of translation. J Biol Chem. 1991;266:19867–70. - PubMed
-
- Dever TE. Gene-specific regulation by general translation factors. Cell. 2002;108:545–56. - PubMed
MeSH terms
Substances
LinkOut - more resources
Full Text Sources
Other Literature Sources
Molecular Biology Databases
