

Quantitative and molecular genetic analyses of mutations increasing Drosophila life span
- PMID: 20686706
- PMCID: PMC2912381
- DOI: 10.1371/journal.pgen.1001037
Quantitative and molecular genetic analyses of mutations increasing Drosophila life span
Abstract
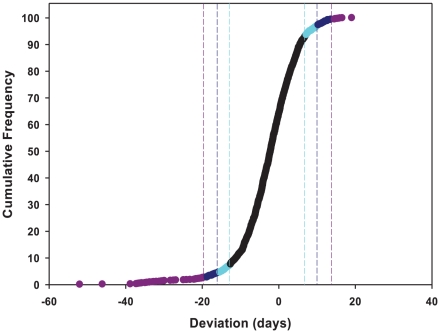
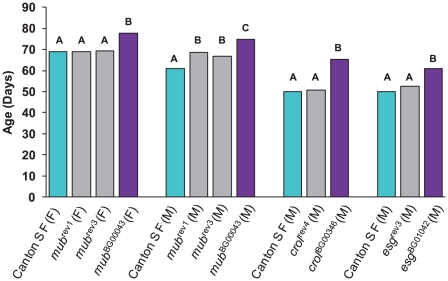
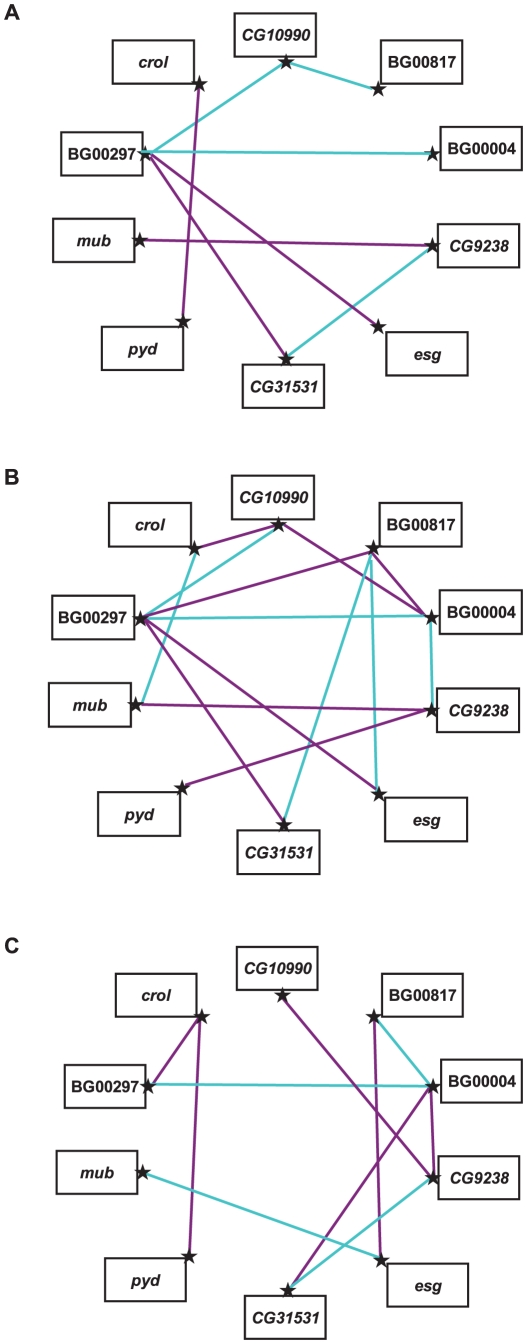
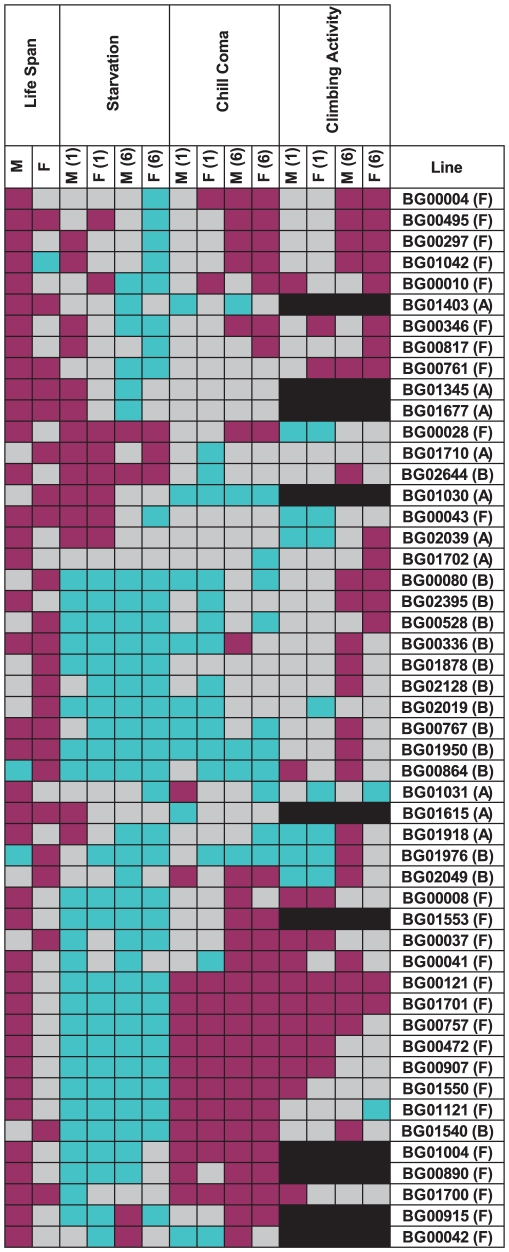
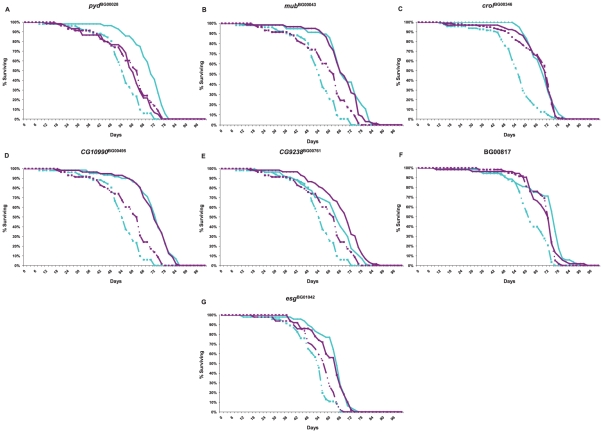
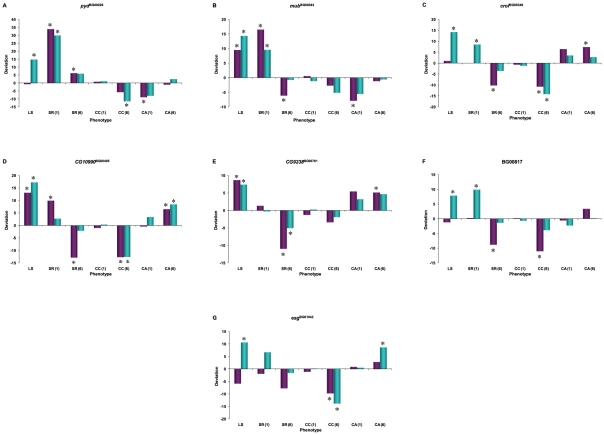
Understanding the genetic and environmental factors that affect variation in life span and senescence is of major interest for human health and evolutionary biology. Multiple mechanisms affect longevity, many of which are conserved across species, but the genetic networks underlying each mechanism and cross-talk between networks are unknown. We report the results of a screen for mutations affecting Drosophila life span. One third of the 1,332 homozygous P-element insertion lines assessed had quantitative effects on life span; mutations reducing life span were twice as common as mutations increasing life span. We confirmed 58 mutations with increased longevity, only one of which is in a gene previously associated with life span. The effects of the mutations increasing life span were highly sex-specific, with a trend towards opposite effects in males and females. Mutations in the same gene were associated with both increased and decreased life span, depending on the location and orientation of the P-element insertion, and genetic background. We observed substantial--and sex-specific--epistasis among a sample of ten mutations with increased life span. All mutations increasing life span had at least one deleterious pleiotropic effect on stress resistance or general health, with different patterns of pleiotropy for males and females. Whole-genome transcript profiles of seven of the mutant lines and the wild type revealed 4,488 differentially expressed transcripts, 553 of which were common to four or more of the mutant lines, which include genes previously associated with life span and novel genes implicated by this study. Therefore longevity has a large mutational target size; genes affecting life span have variable allelic effects; alleles affecting life span exhibit antagonistic pleiotropy and form epistatic networks; and sex-specific mutational effects are ubiquitous. Comparison of transcript profiles of long-lived mutations and the control line reveals a transcriptional signature of increased life span.
Conflict of interest statement
The authors have declared that no competing interests exist.
Figures
Similar articles
-
Quantitative trait loci affecting natural variation in Drosophila longevity.Mech Ageing Dev. 2004 Mar;125(3):179-89. doi: 10.1016/j.mad.2003.12.008. Mech Ageing Dev. 2004. PMID: 15013662
-
Context-dependent genetic architecture of Drosophila life span.PLoS Biol. 2020 Mar 5;18(3):e3000645. doi: 10.1371/journal.pbio.3000645. eCollection 2020 Mar. PLoS Biol. 2020. PMID: 32134916 Free PMC article.
-
Candidate genes affecting Drosophila life span identified by integrating microarray gene expression analysis and QTL mapping.Mech Ageing Dev. 2007 Mar;128(3):237-49. doi: 10.1016/j.mad.2006.12.003. Epub 2006 Dec 28. Mech Ageing Dev. 2007. PMID: 17196240
-
Sex-specific regulation of aging and apoptosis.Mech Ageing Dev. 2006 Sep;127(9):705-18. doi: 10.1016/j.mad.2006.05.001. Epub 2006 Jun 9. Mech Ageing Dev. 2006. PMID: 16764907 Review.
-
The nature of quantitative genetic variation for Drosophila longevity.Mech Ageing Dev. 2002 Jan;123(2-3):95-104. doi: 10.1016/s0047-6374(01)00330-x. Mech Ageing Dev. 2002. PMID: 11718804 Review.
Cited by
-
The genomic landscape and evolutionary resolution of antagonistic pleiotropy in yeast.Cell Rep. 2012 Nov 29;2(5):1399-410. doi: 10.1016/j.celrep.2012.09.017. Epub 2012 Oct 25. Cell Rep. 2012. PMID: 23103169 Free PMC article.
-
Reduced Neuronal Transcription of Escargot, the Drosophila Gene Encoding a Snail-Type Transcription Factor, Promotes Longevity.Front Genet. 2018 Apr 30;9:151. doi: 10.3389/fgene.2018.00151. eCollection 2018. Front Genet. 2018. PMID: 29760717 Free PMC article.
-
How to get the most bang for your buck: the evolution and physiology of nutrition-dependent resource allocation strategies.Proc Biol Sci. 2017 Jun 28;284(1857):20170445. doi: 10.1098/rspb.2017.0445. Proc Biol Sci. 2017. PMID: 28637856 Free PMC article. Review.
-
Polygenic adaptation to overnutrition reveals a role for cholinergic signaling in longevity.bioRxiv [Preprint]. 2023 Jun 14:2023.06.14.544888. doi: 10.1101/2023.06.14.544888. bioRxiv. 2023. PMID: 37398379 Free PMC article. Preprint.
-
The Genomic Basis of Postponed Senescence in Drosophila melanogaster.PLoS One. 2015 Sep 17;10(9):e0138569. doi: 10.1371/journal.pone.0138569. eCollection 2015. PLoS One. 2015. PMID: 26378456 Free PMC article.
References
-
- Medawar PB. An unsolved problem of biology. London: HK Lewis and Co; 1952. pp. 1–24.
-
- Williams GC. Pleiotropy, natural selection and the evolution of senescence. Evolution. 1957;11:398–411.
-
- Harrison DE, Archer JR. Genetic differences in effects of food restriction on aging in mice. J Nutr. 1987;117:376–382. - PubMed
-
- Lin SJ, Defossez PA, Guarente L. Requirement of NAD and SIR2 for life–span extension by caloric restriction in Saccharomyces cerevisiae. Science. 2000;289:2126–2128. - PubMed
Publication types
MeSH terms
Grants and funding
LinkOut - more resources
Full Text Sources
Molecular Biology Databases
