. 2011 Mar;27(3):471-81.
doi: 10.1007/s10554-010-9676-2. Epub 2010 Aug 5.

Functional assessment of coronary artery flow using adenosine stress dual-energy CT: a preliminary study

Affiliations

Functional assessment of coronary artery flow using adenosine stress dual-energy CT: a preliminary study

Michinobu Nagao et al. Int J Cardiovasc Imaging. 2011 Mar.

Abstract

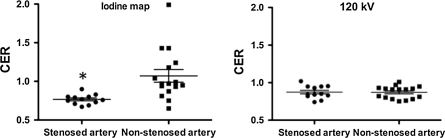
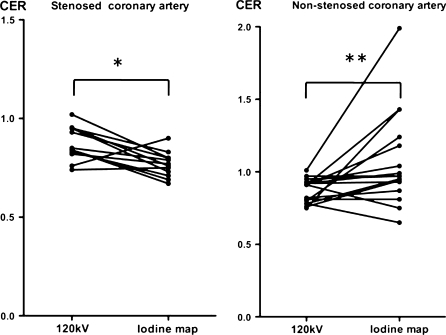
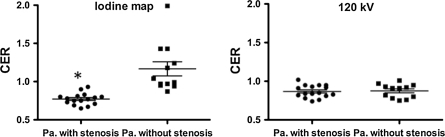
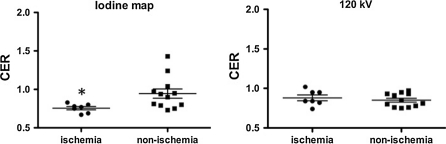
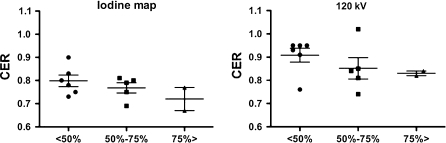
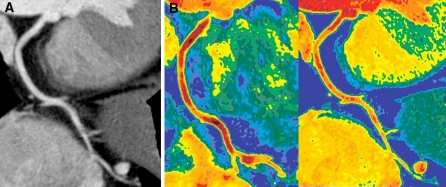
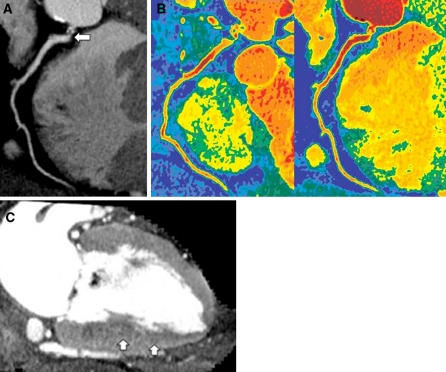
We attempted to assess coronary artery flow using adenosine-stress and dual-energy mode with dual-source CT (DE-CT). Data of 18 patients with suspected coronary arteries disease who had undergone cardiac DE-CT were retrospectively analyzed. The patients were divided into two groups: 10 patients who performed adenosine stress CT, and 8 patients who performed rest CT as controls. We reconstructed an iodine map and composite images at 120 kV (120 kV images) using raw data with scan parameters of 100 and 140 kV. We measured mean attenuation in the coronary artery proximal to the distal portion on both the iodine map and 120 kV images. Coronary enhancement ratio (CER) was calculated by dividing mean attenuation in the coronary artery by attenuation in the aortic root, and was used as an estimate of coronary enhancement. Coronary stenosis was identified as a reduction in diameter of >50% on CT angiogram, and myocardial ischemia was diagnosed by adenosine-stress myocardial perfusion scintigraphy. The iodine map showed that CER was significantly lower for ischemic territories (0.76 ± 0.06) or stenosed coronary arteries (0.77 ± 0.06) than for non-ischemic territories (0.95 ± 0.21, P=0.02) or non-stenosed coronary arteries (1.07 ± 0.33, P<0.001). The 120 kV images showed no difference in CER between these two groups. Use of CER on the iodine map separated ischemic territories from non-ischemic territories with a sensitivity of 86% and a specificity of 75%. Our quantification is the first non-invasive analytical technique for assessment of coronary artery flow using cardiac CT. CER on the iodine map is a candidate method for demonstration of alteration in coronary artery flow under adenosine stress, which is related to the physiological significance of coronary artery disease.


Figures

Fig. 1
Fig. 1
Scatter plot shows the coronary enhancement ratio (CER) for stenotic and non-stenotic coronary arteries under adenosine stress. Horizontal long line represents the mean value and the upper and lower short lines the standard error of the mean. On the iodine map (left), CER was significantly less for stenotic coronary arteries than for non-stenotic coronary arteries (* P < 0.001). On the 120 kV images (right), there was no difference in CER between stenotic and non-stenotic coronary arteries
Fig. 2
Fig. 2
Comparison of the coronary enhancement ratio (CER) of stenotic and non-stenotic arteries on 120 kV images and an iodine map under adenosine stress. In the case of stenotic coronary arteries (left), CER was significantly less on the iodine map than on the 120 kV images (* P < 0.005). In the case of non-stenotic coronary arteries (right), CER was significantly greater on the iodine map than on the 120 kV images (** P = 0.02)
Fig. 3
Fig. 3
Scatter plot shows the coronary enhancement ratio (CER) for patients with and without stenotic coronary arteries under adenosine stress. Horizontal lines are the same as in Fig. 1. On the iodine map (left), CER was significantly less for patients with stenotic coronary arteries than for those without them (* P < 0.0001). On the 120 kV images (right), there was no difference in CER between patients with and without stenotic coronary arteries. Pa patients
Fig. 4
Fig. 4
Scatter plot shows the coronary enhancement ratio (CER) for ischemic territories and non-ischemic territories under adenosine stress. Horizontal lines are the same as in Fig. 1. On the iodine map (left), CER was significantly less for ischemic than for non-ischemic territories (* P = 0.02). On the 120 kV images (right), there was no difference in CER between ischemic and non-ischemic territories
Fig. 5
Fig. 5
Scatter plot shows the coronary enhancement ratio (CER) for territories with a coronary stenosis of <50, 50–75, and >75% on invasive coronary angiography under adenosine stress. On the iodine map (left), CER tended to decrease with progression of coronary stenosis. This tendency was not clearly observed at 120 kV
Fig. 6
Fig. 6
Coronary images during adenosine stress in a 71-year-old female with normal coronary arteries. a Curved multiplanar reformatted image at 120 kV shows no stenosis and no plaque in the right coronary artery. b Colored coronary images demonstrate higher attenuation within the coronary artery on the iodine map (right) than on the 120 kV image (left). The average attenuation for the right coronary artery was 287 HU on the 120 kV images and 444 HU on the iodine map. The CER value was 0.8 on the 120 kV images and 1.24 on the iodine map. The color scale uses a gradient of warm colors, classified into six steps by Hounsfield units (HU) as follows: 150–200, 201–250, 251–300, 301–350, 351–400, 401–450 HU. Yellow indicates the lowest attenuation and dark red indicates the highest
Fig. 7
Fig. 7
Coronary and myocardial images during adenosine stress in a 55-year-old male with severe stenosis of the right coronary artery. a Curved multiplanar reformatted image at 120 kV shows severe ostial stenosis of the right coronary artery (arrow). b Colored coronary images demonstrate higher attenuation within the coronary artery on the 120 kV images (left) than on the iodine map (right). The average attenuation for the right coronary artery was 338 HU on the 120 kV images and 318 HU on the iodine map. The CER value was 0.82 on the 120 kV images and 0.77 on the iodine map. The color scale used is the same as that in Fig. 4b. c Vertical long-axis slice (myocardial image) reconstructed from the same data as the 120 kV coronary angiogram shows a region of subendocardial hypo-enhancement in the inferior wall (arrows), suggestive of myocardial ischemia

References

    1. Leschka S, Alkadhi H, Plass A, et al. Accuracy of MSCT coronary angiography with 64-slice technology: first experience. Eur Heart J. 2005;26:1482–1487. doi: 10.1093/eurheartj/ehi261. - DOI - PubMed
    1. Raff GL, Gallagher MJ, Oneill WW, Goldstein JA. Diagnostic accuracy of noninvasive coronary angiography using 64-slice spiral computed tomography. J Am Coll Cardiol. 2005;46:552–557. doi: 10.1016/j.jacc.2005.05.056. - DOI - PubMed
    1. White CW, Wright CB, Doty DB, et al. Does visual interpretation of the coronary arteriogram predict the physiologic importance of a coronary stenosis? N Engl J Med. 1984;310:819–824. doi: 10.1056/NEJM198403293101304. - DOI - PubMed
    1. Kern MJ, Lerman A, Bech JW, et al. Physiological assessment of coronary artery disease in the cardiac catheterization laboratory: a scientific statement from the American Heart Association Committee on Diagnostic and Interventional Cardiac Catheterization, Council on Clinical Cardiology. Circulation. 2006;114:1321–1341. doi: 10.1161/CIRCULATIONAHA.106.177276. - DOI - PubMed
    1. Tobis J, Azarbal B, Slavin L. Assessment of intermediate severity coronary lesions in the catheterization laboratory. J Am Coll Cardiol. 2007;49:839–848. doi: 10.1016/j.jacc.2006.10.055. - DOI - PubMed

MeSH terms