

Organ-wide telomeric status in diseased and disease-free prostatic tissues
- PMID: 20687220
- PMCID: PMC3920907
- DOI: 10.1002/pros.21182
Organ-wide telomeric status in diseased and disease-free prostatic tissues
Abstract
Background: Telomere attrition occurs early in the development of prostatic adenocarcinoma. However, little is known about either telomere status in benign prostatic hyperplasia (BPH), or the spatial and organ-wide distribution of potential telomere aberrations throughout all areas of prostatic glands affected by cancer or BPH.
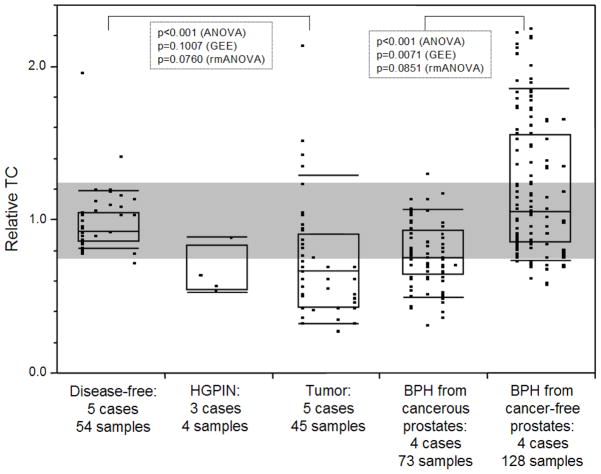
Methods: Slot blot titration assay was used to determine telomere DNA content (TC), a proxy for telomere length, in macrodissected tissue consisting of 54 normal samples from 5 disease-free prostates, 128 BPH samples from 4 non-cancerous prostates, and 45 tumor, 73 BPH, and 4 prostatic intraepithelial neoplasia (PIN) samples from 5 cancerous prostates.
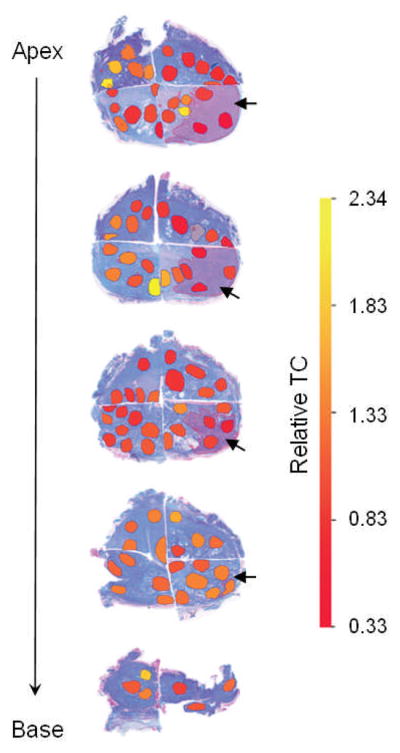
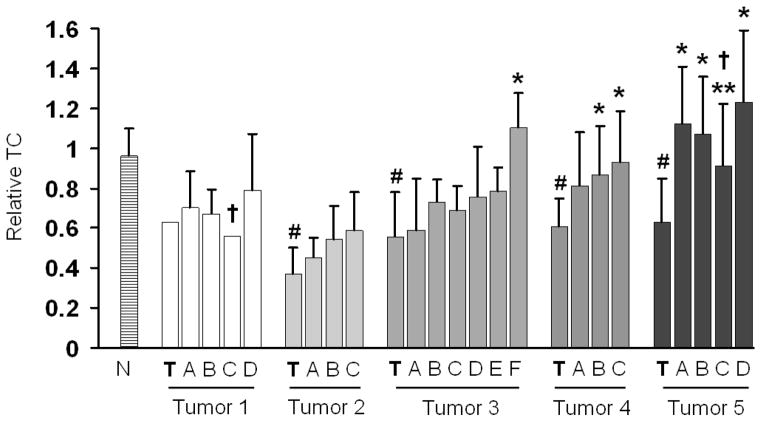
Results: Compared to TC in normal prostate samples (n = 54; TC mean = 0.98), tumor samples displayed telomere attrition (n = 45; TC mean = 0.67). TC in PIN samples was similar to tumors. TC in BPH samples from cancerous prostates was similar to TC in tumors and also displayed telomere shortening (n = 73; TC mean = 0.76), whereas BPH samples from non-cancerous prostates displayed longer telomeres (n = 128; TC mean = 1.06). In prostates affected by adenocarcinoma, areas of potential telomere attrition occurred in histologically normal tissues through the entire gland. However, three-dimensional zoning revealed a pattern of increasing TC as a function of distance from the primary (index) tumor.
Conclusions: Spatial distributions of TC in prostate specimens indicate a complex "field effect" with varying contributions from both cancer and BPH. The observation that telomere length variations occur in fields of histologically normal tissues surrounding the tumor is of clinical importance, as it may have implications for the diagnosis and focal therapy of prostate cancer.
Figures
Similar articles
-
Transforming growth factor beta 1 and its receptor types I and II. Comparison in human normal prostate, benign prostatic hyperplasia, and prostatic carcinoma.Growth Factors. 1998;16(2):101-10. doi: 10.3109/08977199809002121. Growth Factors. 1998. PMID: 9932228
-
Widespread telomere instability in prostatic lesions.Mol Carcinog. 2016 May;55(5):842-52. doi: 10.1002/mc.22326. Epub 2015 Apr 27. Mol Carcinog. 2016. PMID: 25917938
-
Expression of c-kit and kit-ligand in benign and malignant prostatic tissues.Histol Histopathol. 2000 Apr;15(2):365-74. doi: 10.14670/HH-15.365. Histol Histopathol. 2000. PMID: 10809354
-
Fingerprinting the diseased prostate: associations between BPH and prostate cancer.J Cell Biochem. 2004 Jan 1;91(1):161-9. doi: 10.1002/jcb.10739. J Cell Biochem. 2004. PMID: 14689588 Review.
-
A Systematic Review of the Zinc Content of the Normal Human Prostate Gland.Biol Trace Elem Res. 2021 Oct;199(10):3593-3607. doi: 10.1007/s12011-020-02495-z. Epub 2020 Nov 25. Biol Trace Elem Res. 2021. PMID: 33237491
Cited by
-
A Rare Heterozygous TINF2 Deletional Frameshift Mutation in a Chinese Pedigree With a Spectrum of TBDs Phenotypes.Front Genet. 2022 Jul 7;13:913133. doi: 10.3389/fgene.2022.913133. eCollection 2022. Front Genet. 2022. PMID: 35873475 Free PMC article.
-
Prostate field cancerization: deregulated expression of macrophage inhibitory cytokine 1 (MIC-1) and platelet derived growth factor A (PDGF-A) in tumor adjacent tissue.PLoS One. 2015 Mar 13;10(3):e0119314. doi: 10.1371/journal.pone.0119314. eCollection 2015. PLoS One. 2015. PMID: 25767870 Free PMC article.
-
Early growth response 1 and fatty acid synthase expression is altered in tumor adjacent prostate tissue and indicates field cancerization.Prostate. 2012 Aug 1;72(11):1159-70. doi: 10.1002/pros.22465. Epub 2011 Nov 29. Prostate. 2012. PMID: 22127986 Free PMC article.
-
Telomere length variation in tumor cells and cancer-associated fibroblasts: potential biomarker for hepatocellular carcinoma.J Pathol. 2017 Dec;243(4):407-417. doi: 10.1002/path.4961. Epub 2017 Oct 13. J Pathol. 2017. PMID: 28833123 Free PMC article.
-
Changes in TP53 Gene, Telomere Length, and Mitochondrial DNA in Benign Prostatic Hyperplasia Patients.Biomedicines. 2024 Oct 15;12(10):2349. doi: 10.3390/biomedicines12102349. Biomedicines. 2024. PMID: 39457663 Free PMC article.
References
-
- De Marzo AM, Meeker AK, Zha S, Luo J, Nakayama M, Platz EA, Isaacs WB, Nelson WG. Human prostate cancer precursors and pathobiology. Urology. 2003;62(5 Suppl 1):55–62. - PubMed
-
- Joshua AM, Evans A, Van der Kwast T, Zielenska M, Meeker AK, Chinnaiyan A, Squire JA. Prostatic preneoplasia and beyond. Biochim Biophys Acta. 2008;1785(2):156–181. - PubMed
-
- Dong JT. Prevalent mutations in prostate cancer. J Cell Biochem. 2006;97(3):433–447. - PubMed
-
- Feldser DM, Hackett JA, Greider CW. Telomere dysfunction and the initiation of genome instability. Nat Rev Cancer. 2003;3(8):623–627. - PubMed
-
- Gisselsson D, Jonson T, Petersen A, Strombeck B, Dal Cin P, Hoglund M, Mitelman F, Mertens F, Mandahl N. Telomere dysfunction triggers extensive DNA fragmentation and evolution of complex chromosome abnormalities in human malignant tumors. Proc Natl Acad Sci U S A. 2001;98(22):12683–12688. - PMC - PubMed
Publication types
MeSH terms
Grants and funding
LinkOut - more resources
Full Text Sources
Medical
