. 2010 Aug 31;49(34):7323-43.
doi: 10.1021/bi100588a.

Congruency between biophysical data from multiple platforms and molecular dynamics simulation of the double-super helix model of nascent high-density lipoprotein

Affiliations

Congruency between biophysical data from multiple platforms and molecular dynamics simulation of the double-super helix model of nascent high-density lipoprotein

Valentin Gogonea et al. Biochemistry. .

Abstract

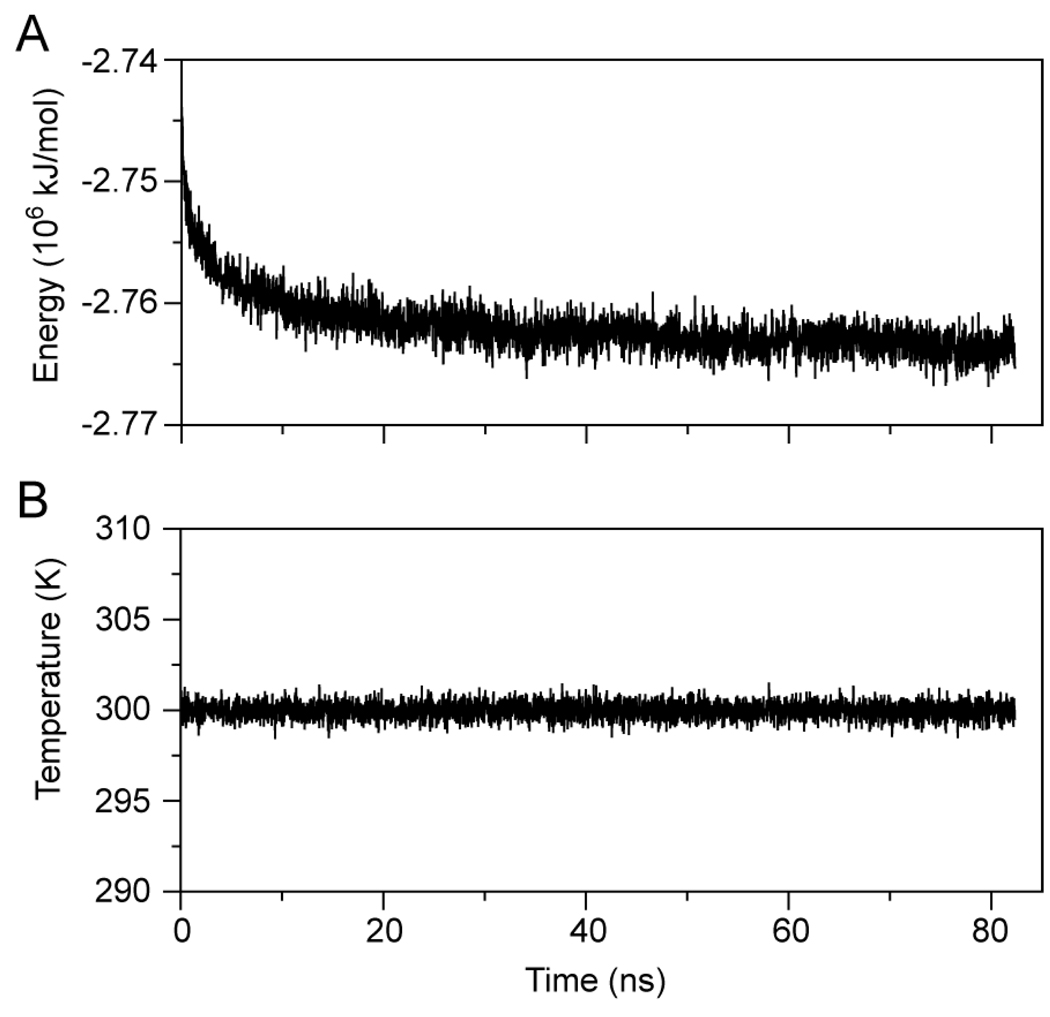
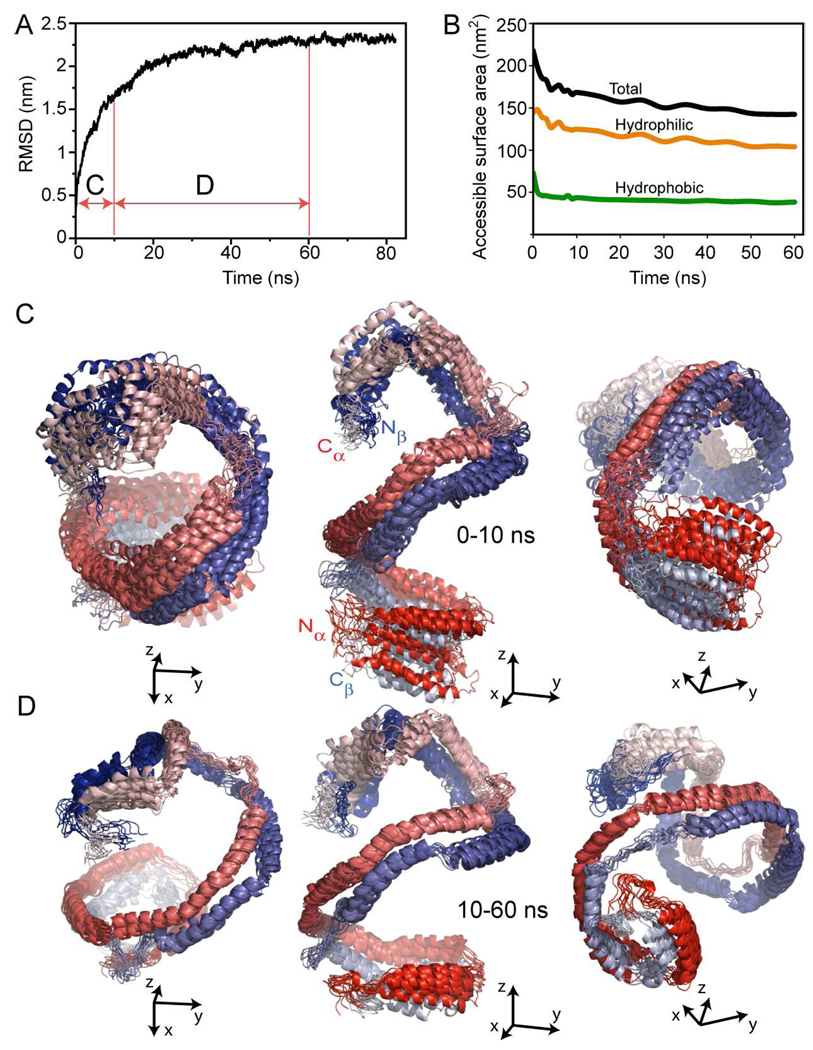
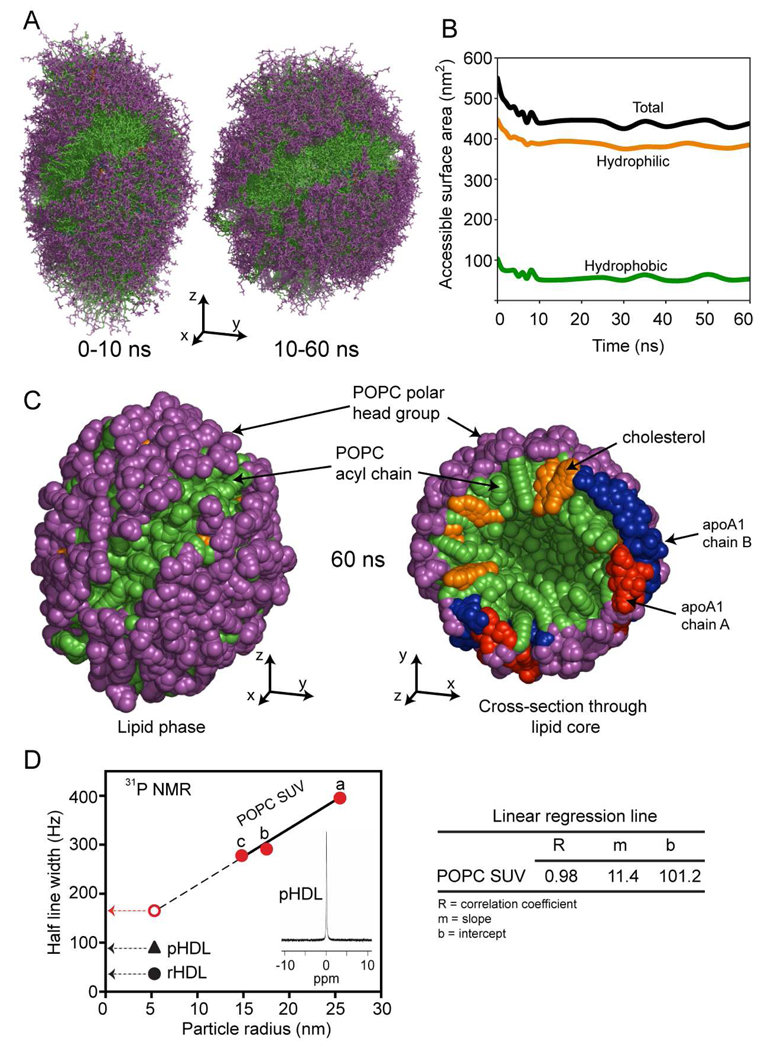
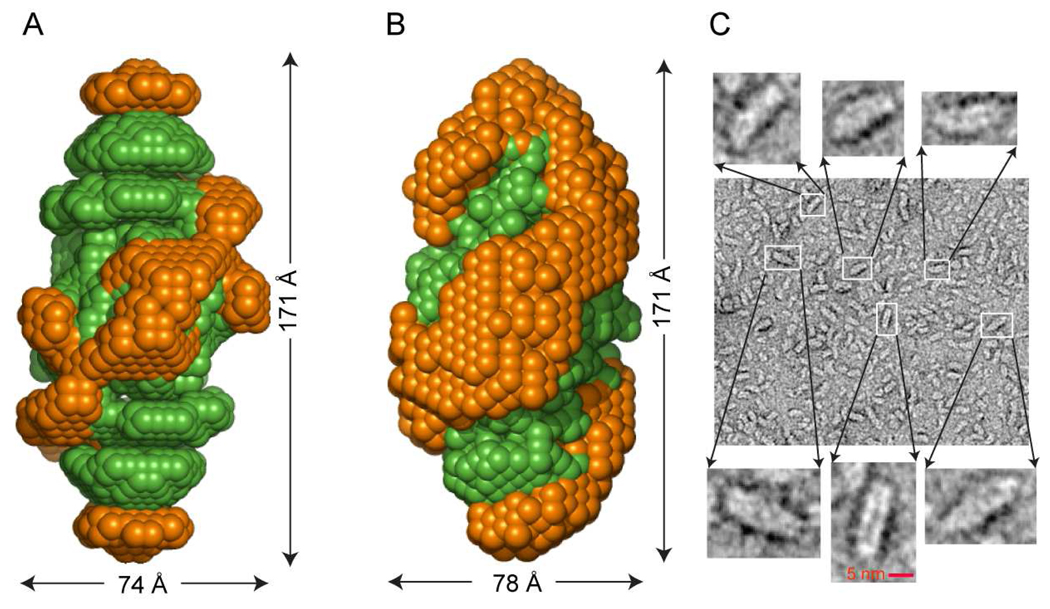
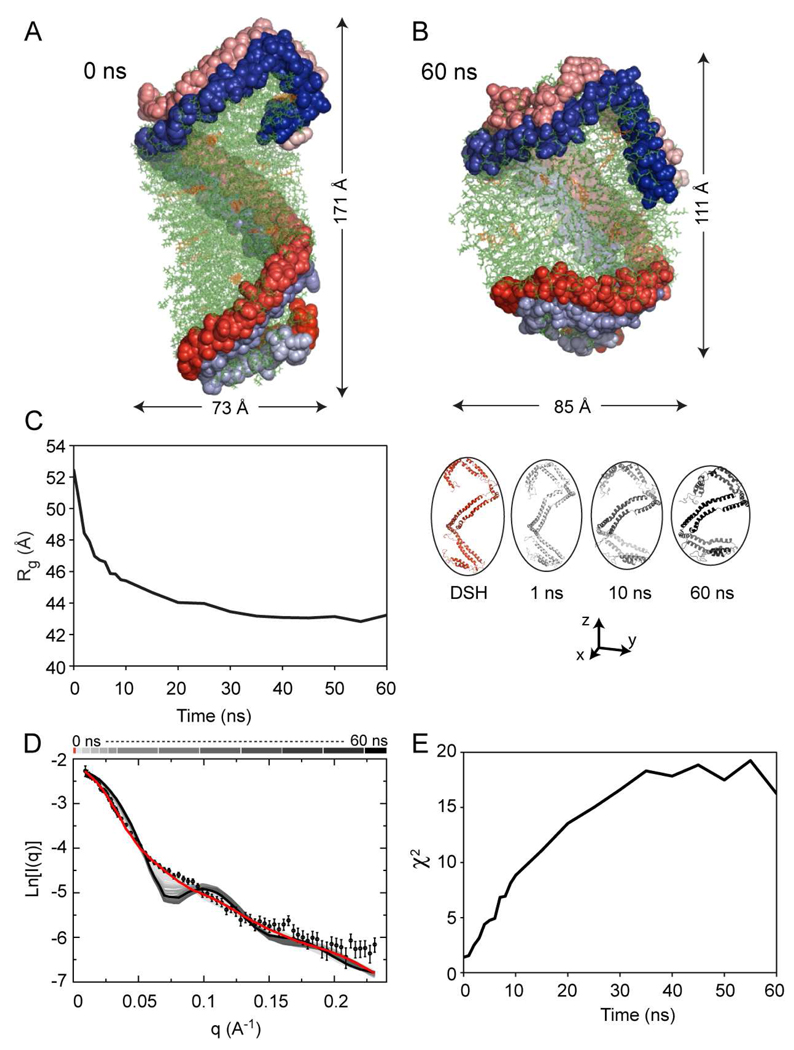
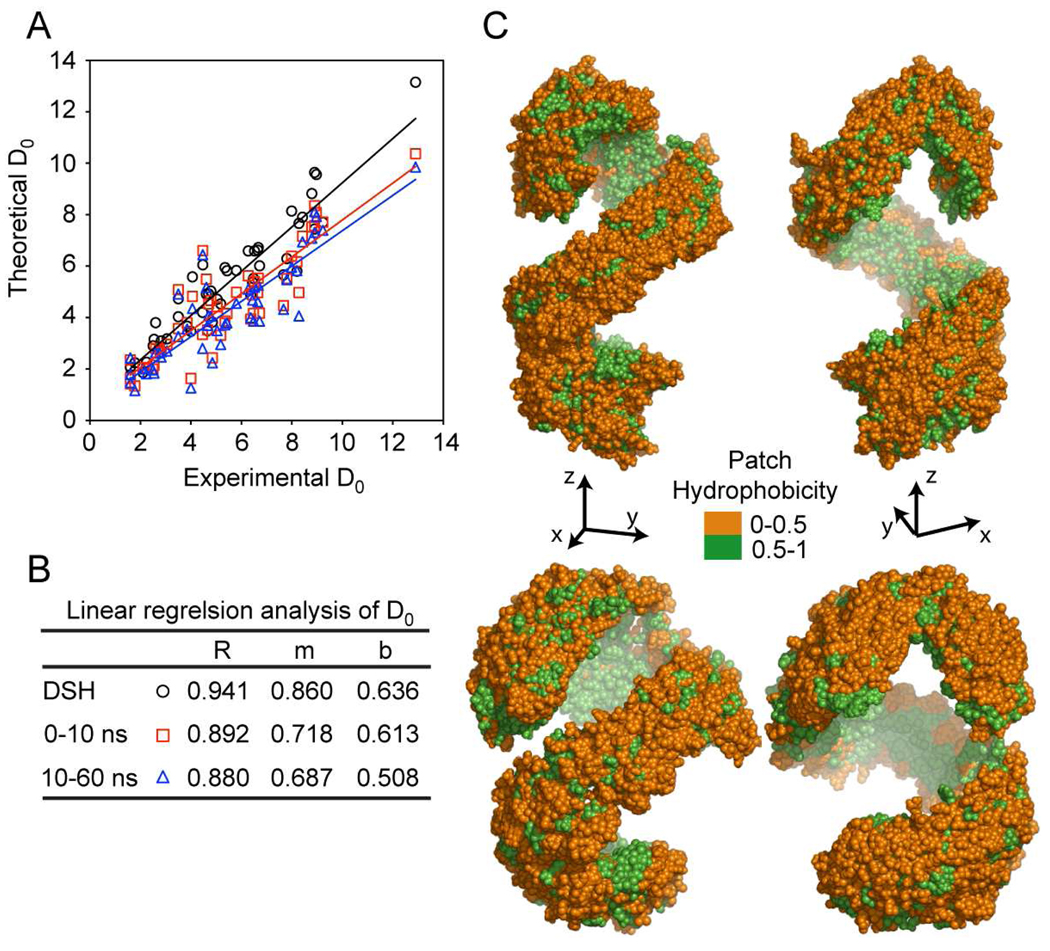
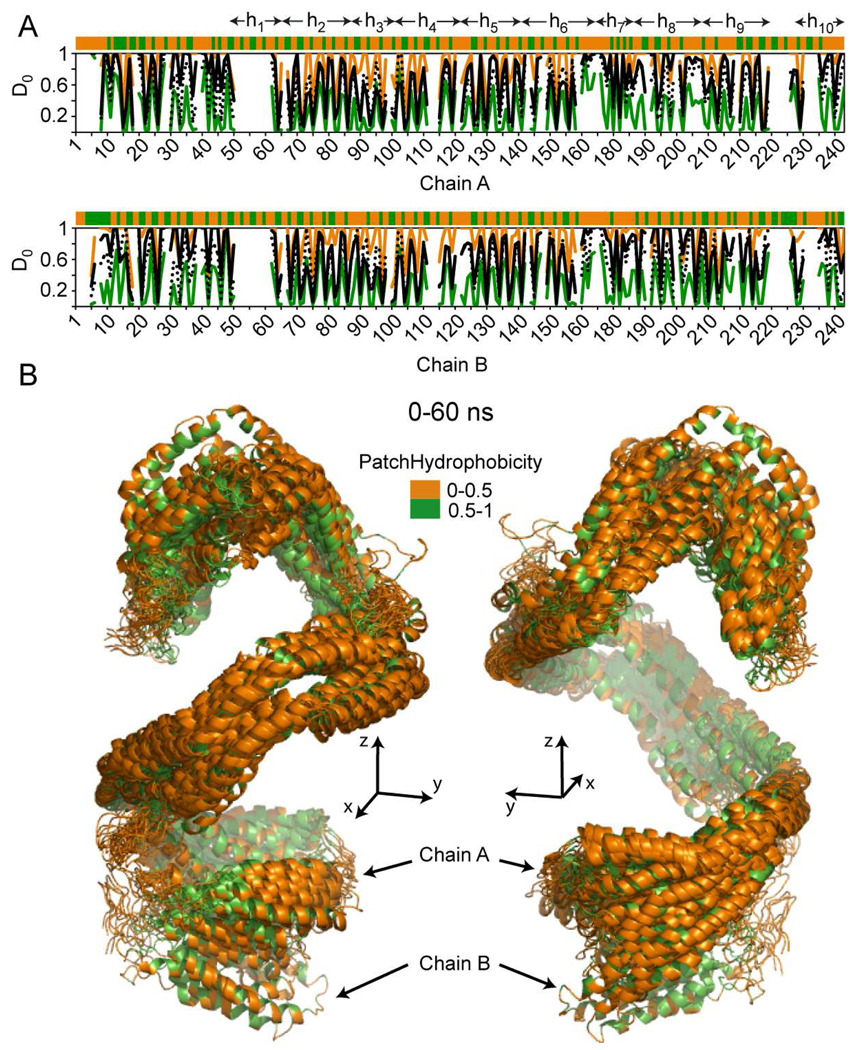
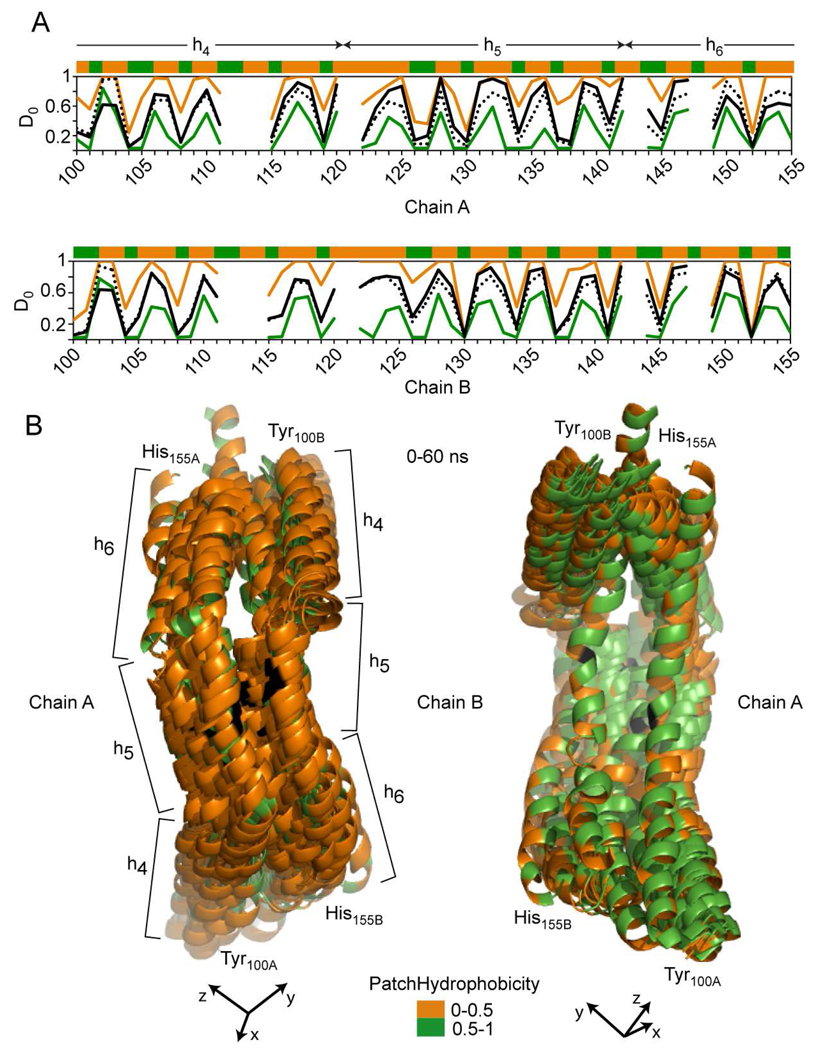
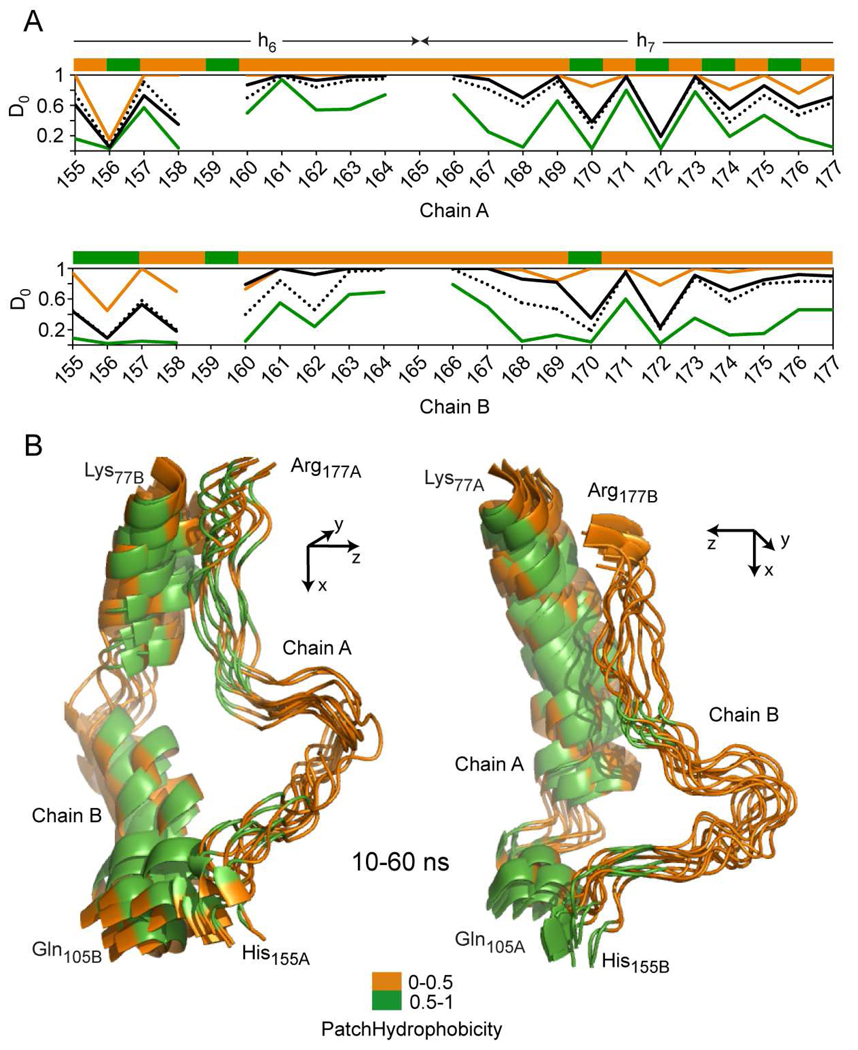
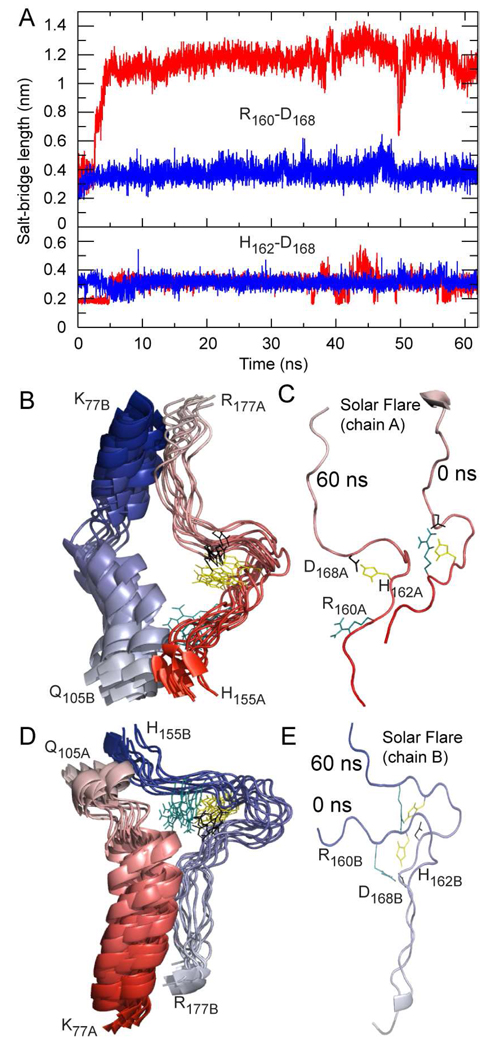
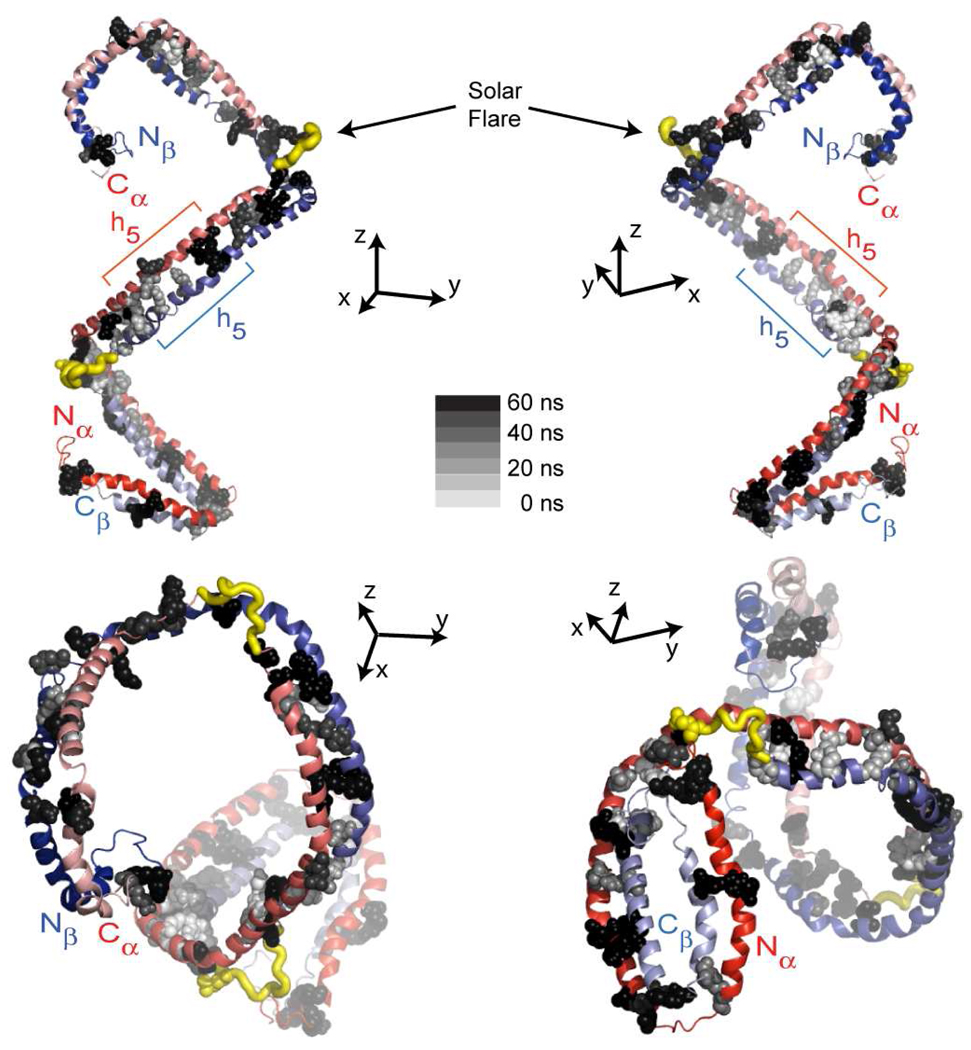
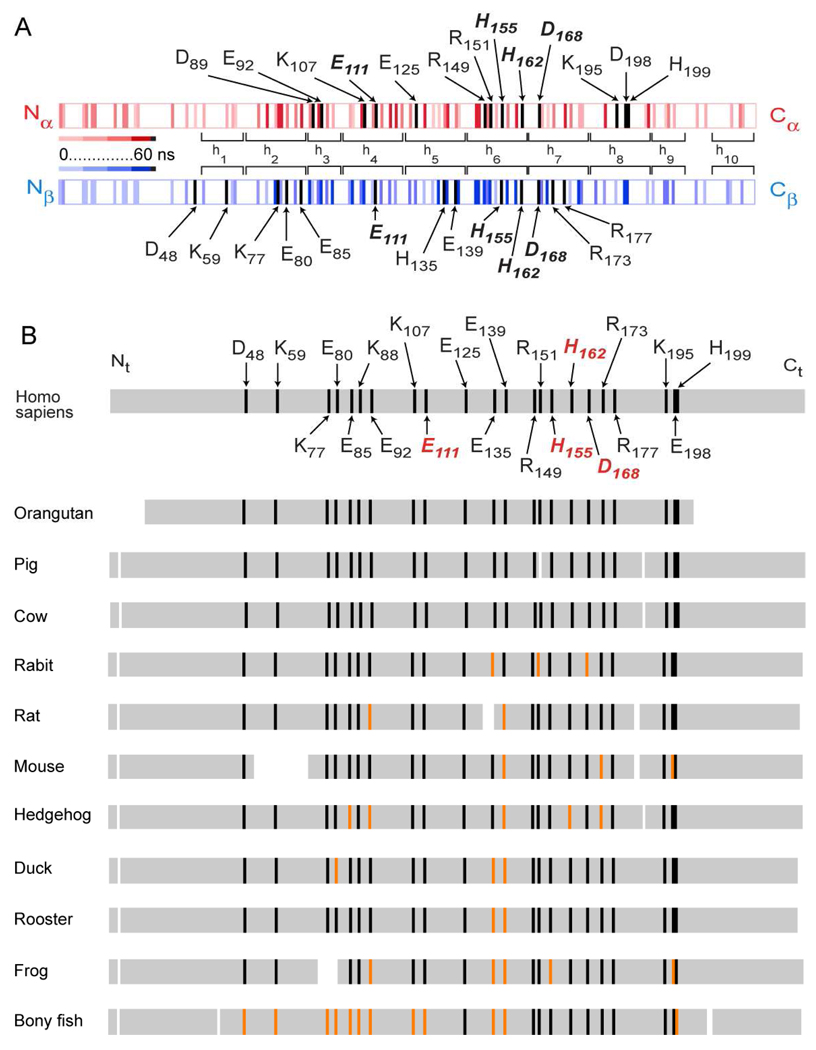
The predicted structure and molecular trajectories from >80 ns molecular dynamics simulation of the solvated Double-Super Helix (DSH) model of nascent high-density lipoprotein (HDL) were determined and compared with experimental data on reconstituted nascent HDL obtained from multiple biophysical platforms, including small angle neutron scattering (SANS) with contrast variation, hydrogen-deuterium exchange tandem mass spectrometry (H/D-MS/MS), nuclear magnetic resonance spectroscopy (NMR), cross-linking tandem mass spectrometry (MS/MS), fluorescence resonance energy transfer (FRET), electron spin resonance spectroscopy (ESR), and electron microscopy. In general, biophysical constraints experimentally derived from the multiple platforms agree with the same quantities evaluated using the simulation trajectory. Notably, key structural features postulated for the recent DSH model of nascent HDL are retained during the simulation, including (1) the superhelical conformation of the antiparallel apolipoprotein A1 (apoA1) chains, (2) the lipid micellar-pseudolamellar organization, and (3) the solvent-exposed Solar Flare loops, proposed sites of interaction with LCAT (lecithin cholesteryl acyltransferase). Analysis of salt bridge persistence during simulation provides insights into structural features of apoA1 that forms the backbone of the lipoprotein. The combination of molecular dynamics simulation and experimental data from a broad range of biophysical platforms serves as a powerful approach to studying large macromolecular assemblies such as lipoproteins. This application to nascent HDL validates the DSH model proposed earlier and suggests new structural details of nascent HDL.


Figures

FIGURE 1
FIGURE 1
Energy and temperature fluctuations during the molecular dynamic simulation of nascent HDL in solution. A, Fluctuation in the total potential energy of the simulation cell. The graph shows that it takes about 30 ns simulation for the system to reach thermodynamic equilibrium. B, Fluctuation in the absolute temperature; the system maintains in average the temperature setup for simulation (300 K).
FIGURE 2
FIGURE 2
Root mean square deviation (RMSD) of apoA1 backbone from the conformation of apoA1 in the Double Super Helix model of nascent HDL. A, Fluctuation in the root mean square displacement (RMSD) of apoA1 backbone conformation during simulation. The graph shows that most of the conformational change in apoA1 backbone occurs in the first 10 ns of simulation. B, Change in the total (black curve), hydrophilic (orange curve) and hydrophobic (green curve) solvent accessible surface area (SASA) of apoA1 during simulation. Most of solvent accessible surface of apoA1 (~80%) is made of hydrophilic amino acid residues. B, Superposition of 11 simulation snapshots taken 1 ns apart during the first 10 ns. ApoA1 chains are gradient colored red (chain A) and blue (chain B) with the N-termini colored dark red/blue and C-termini colored light red/blue. The left and right panels show the same superposition of frames from different vantage points with the N-terminal of chain A pointing outward in the left panel, and the N-terminal of chain B pointing outward in the right panel. C, Conformational changes of apoA1 backbone during the next 50 ns simulation: the three panes confirm the result in Fig 2A, that is, there is little change in the conformation of apoA1 backbone after the first 10 ns simulation. In the left and right panels the N/C-termini pairs of apoA1 point outward emphasizing the helical shape of apoA1, which is retained during the entire simulation.
FIGURE 3
FIGURE 3
The simulation trajectory of the lipid phase component of nascent HDL. A, Left panel: superposition of 11 snapshots taken during the first 10 ns simulation. The polar head groups of POPC are colored purple and the acyl chains are colored green. Cholesterol is colored orange. Right panel: superposition of 11 snapshots taken during simulation in the next 50 ns (from 10 to 60 ns). The superposition shows that the lipid core becomes more spheroidal, and that the most significant change in its shape takes place during the first 10 ns. B, The change in the hydrophobic (green), hydrophilic (orange) and total (black) solvent accessible surface area during simulation. C, Left panel: The packing of the lipid core after 60 ns simulation. The polar heads of POPC are shown as purple beads, while the acyl chains are shown as green beads. Cholesterol molecules are colored orange. Right panel: cross section through the lipid core and apoA1 double chain (red/blue). The panel shows the micellar-lamellar structure of the lipid core with the POPC polar heads groups oriented radially toward solvent and acyl chains pointing inside. D, Plot of half-line width of the 31P NMR spectrum recorded for multiple distinct small unilamellar vesicles (SUV) of differing size produced from POPC, reconstituted HDL (rHDL) and nascent HDL isolated from human plasma (pHDL). Preparation of SUV with diameters greater than 20 nm were generated by extrusion through polycarbonate filters with 0.4 mm, 0.1 mm, 0.05 mm and 0.03 mm pore sizes sequentially for 15 times. Preparation of POPC SUV with diameter 17.6 nm was generated similarly as POPC SUV with diameter of 25. 6 nm, but with 30 times extrusion. Preparation of POPC SUV with diameter of 14.9 nm was generated using cholate dialysis method.
FIGURE 4
FIGURE 4
Low resolution structures of nascent HDL from small angle neutron scattering (SANS) and images from electron microscopy; the Double Super Helix (DSH) model and the model obtained after 60 ns simulation. A, Superposition of SANS low resolution structures of apoA1 (orange) and lipid core (green) of nascent HDL obtained from processing scattering intensities collected at Intitut Laue-Langevin in Grenoble, France as previously reported (13). B, Repeat low resolution structures for protein and lipid within rHDL preparations obtained from data collected at JCNS, Garshing, Germany, in the present studies. C, Electron microscopy micrograph of rHDL preparations. Detailed magnified insets show that the majority of the particles are prolate ellipsoids.
FIGURE 5
FIGURE 5
Comparison of experimental and calculated small angle neutron scattering (SANS) intensities for the Double Super Helix (DSH) model of nascent HDL, and models obtained during 60 ns simulation. A, The DSH model of nascent HDL; apoA1 is represented with spheres with the two chains colored in red and blue fading from the N to the C terminal. The phospholipid is colored green and free cholesterol is colored orange. B, The model of nascent HDL obtained from simulation after 60 ns. C, Left: The radius of gyration (Rg) during the simulation trajectory is shown. Right: Conformations of apoA1 (cartoon representation) in the DSH model (red) and after 1, 10 and 60 ns simulation. D, Comparison of the experimental scattering intensity (open circles with error bars) with those obtained by calculation from the DSH model (red line) and all 22 snapshots during the simulation trajectory (various shades of gray). The gray shades bar at the top of the graph color codes the intensity curves: light gray shades are used for conformations of apoA1 at the beginning of the simulation and dark gray shades are used for conformation towards the end of the simulation. The intensity line corresponding to the last simulation snapshot (60 ns) is colored black. E, The χ2 statistics, that gauges goodness of fit between the experimental and theoretical intensities, is shown as a function of simulation time. χ2 = 1.37 for the DSH model.
FIGURE 6
FIGURE 6
Comparison between experimental and calculated deuterium incorporation factors (D0) using molecular dynamics trajectory snapshots. A, Experimental vs. theoretical D0 values and regression lines corresponding to the Double Super Helix model (black, open circle), the average over 11 snapshots in the first 10 ns (red, open square), and average over 11 snapshots between 10 to 60 ns (blue, open triangle). B, The correlation coefficients (R) between experimental vs. theoretical D0 values, and the slope (m) and the intercept (b) of the linear regression lines for the D0 values. C, Top: Patch hydrophobicity of apoA1 in nascent HDL from simulation frames in the range 0–10 ns. The hydrophilic surface is colored orange and the hydrophobic surface is colored green. Bottom: Patch hydrophobicity of apoA1 in nascent HDL from simulation frames in the range 10–60 ns.
FIGURE 7
FIGURE 7
Hydrogen deuterium exchange incorporation factors (D0) and patch hydrophobicity of full length apoA1 in nascent HDL. A, Top: patch hydrophobicity (top orange/green stripe), and comparison between experimental (black line) and calculated D0 values for residues in of apoA1 chain A. The orange and green lines identify the maximum and minimum of D0 range of fluctuations calculated from simulation snapshots. The black dotted line represents the average of calculated D0 values obtained from all 22 snapshots taken during the first 60 ns simulation and used for analysis. On top of the patch hydrophobicity stripe the traditional α-helix domains on apoA1 (h1 to h10) are identified. Bottom: similar information is displayed for residues in chain B of apoA1. These two plots show that the average D0 obtained from simulation follows the same pattern as the experimentally-derived D0. B, Superposition of all 22 snapshots of apoA1 (chain A and B) taken during first 60 ns simulation; the apoA1 chains are shown in cartoon representation. The residues are colored according to their patch hydrophobicity (orange = solvent accessible residues and green = buried residues). Left and Right panels show the trajectory of apoA1 in two different orientations. In the left panel helix 5 is facing upfront, while in the right panel helix 5 is facing away from the viewer.
FIGURE 8
FIGURE 8
Hydrogen deuterium exchange incorporation factors (D0) and patch hydrophobicity in an α-helix region of apoA1 (Y100-H155) that hosts helix h4 (P99-E120), helix h5 (P121-S142) and part of helix h6 (P143-A164). A, Top: patch hydrophobicity (top stripe), and comparison between experimental (black line) and calculated D0 values for residues in Tyr100-His155 region of apoA1 chain A. The orange and green lines identify the maximum and minimum for range of fluctuations of D0 values calculated from simulation snapshots. The black dotted line shows the average value of calculated D0 obtained from all 22 snapshots taken during the 60 ns simulation and used for analysis. Bottom: similar information is displayed for Tyr100-His155 region of chain B of apoA1. These two plots show that the average values of D0 obtained from simulation follow the same pattern as the experimentally-derived D0 values, and agree well with the latter. B, Superposition of all 22 snapshots of the Tyr100-His155 region (chain A and B) taken during 60 ns simulation. The apoA1 chains are shown in cartoon representation indicating that this region of the protein maintains α-helix secondary structure during the entire simulation. The residues are colored according to their patch hydrophobicity (orange = solvent accessible residues and green = berried residues). h5 of apoA1 is facing upward (out of the page) due to the curvature of the apoA1 chains. As a reference point, Gly129, the middle point of h5, is shown in black. The left, and right panels show the trajectory of Tyr100-His155 region in different orientations. The left panel shows the trajectory having the solvent accessible surface (orange) of residues facing upfront, while the right panel shows the trajectory with the buried residues surface (green) facing upfront. h5 is facing away (into the page).
FIGURE 9
FIGURE 9
Hydrogen deuterium exchange incorporation factors (D0) and patch hydrophobicity in the Solar Flare region of apoA1 (H155-R177) that hosts helix part of helix h6 (P143-A164), and part of helix h7 (P165-G186). A, Top: patch hydrophobicity (top stripe), and comparison between experimental (black line) and calculated D0 values for residues in His155-Arg177 region of apoA1 chain A. The orange and green lines identify the maximum and minimum for range of fluctuations of D0 values calculated from simulation snapshots. The black dotted line shows the average value of calculated D0 obtained from all 22 snapshots taken during the 60 ns simulation and used for analysis. Bottom: similar information is displayed for His155-Arg177 region of chain B of apoA1. These two plots show that the average values of D0 obtained from simulation follow the same pattern as the experimentally-derived D0 values, and agree well with the latter. B, For clarity, this picture shows the superposition only of 11 snapshots of the His155-Arg177 region (chain A and B) taken between 10 and 60 ns. The apoA1 chains are shown in cartoon representation and Tyr166 (one of the sites for selective oxidation) is shown in stick-representation and colored black. The residues are colored according to their patch hydrophobicity (orange = solvent accessible residues and green = berried residues). Left panel shows the trajectory of the Solar Flare region of chain A (His155A-Arg177A) and the Right panel shows the trajectory of the Solar Flare region of chain B (His155B-Arg177B).
FIGURE 10
FIGURE 10
Molecular dynamics simulation trajectory of the Solar Flare loops (His155-Arg177) and the predominantly α-helix sequences (Lys77-Gln105), from the adjacent chain of apoA1 in the Double Super Helix model of Nascent HDL. The trajectory is composed of 11 snapshots in the interval 10–60 ns. Chain A of apoA1 is colored red and chain B is colored blue with the color fading from the N-terminal toward the C-terminal. A, Fluctuations in the length of salt-bridges R160-D168 (upper panel) and H162-D168 (lower panel, red for chain A and blue for chain B) during simulation. The upper panel graph shows that the R160-D168 salt-bridge in chain A breaks after approximately 2 ns and remains mainly broken during the entire simulation, but is reformed briefly when the simulation reaches 50 ns. On the contrary, the R160-D168 salt-bridge in chain B is conserved during the simulation. The lower panel shows that the H162-D168 salt-bridges in both chains are conserved during the entire simulation. B, Superposition of the eleven snapshots of the Solar Flare of chain A and the adjacent α-helix of chain B taken during 10–60 ns of simulation. The residues involved in salt-bridges are colored and shown as sticks (cyan = R160, yellow = H162, black = D168). The superposition shows that the Solar Flare conformation (chain A) changes little during simulation and remains unfolded and solvent exposed as proposed in the Double Super Helix model of HDL. C, The conformation of the Solar Flare loop (chain A) at the beginning of the simulation (0 ns) and after 60 ns. A comparison of the two snapshots indicates that the shape of the Solar Flare loop remains approximately the same regardless of one salt-bridge (R160-D168) being broken. D, Superposition of the eleven snapshots of the Solar Flare (chain B) and the adjacent α-helix of chain A taken during 10–60 ns of simulation. This trajectory shows that the two salt-bridges are conserved in all frames displayed. E, The conformation of the Solar Flare loop (chain B) at the beginning of the simulation (0 ns) and after 60 ns. The two snapshots indicate that the shape of the Solar Flare loop remains approximately the same.
FIGURE 11
FIGURE 11
Predicted salt bridge distribution in apoA1 during 60 ns of molecular dynamics simulation. The conformation of apoA1 shown from a different vantage point with the N/C-termini pointing toward/away from the reader. The figure shows that the salt bridges located toward N/C-termini are more persistent (colored black or dark grey) during simulation while those located at the middle region of apoA1 are less persistent (colored light grey).
FIGURE 12
FIGURE 12
Map of charged amino acid residues involved in salt bridges during the simulation and their conservation between species. A, Distribution of residues predicted to form inter- and intra-chain salt bridges in apoA1 during simulation. ApoA1 dimer is shown as a double stripe colored red for chain A and blue for chain B. Residues predicted to be involved in a salt bridge during the simulation trajectory are shown as vertical stripes. The predicted persistence of residues within a salt bridge during the simulation trajectory is indicated by the intensity of color, with lighter color used for less persistence and darker color for longer persistence. Residues that persist more than 95% of the simulation are colored black. B, Analysis of species conservation of apoA1 residues predicted to persist (> 95%) within inter- and intra-chain salt bridges throughout the simulation trajectory. Residues (n=22) that persist more than 95% of the simulation are indicated on Homo sapiens (black) and those that are common to both chains of apoA1 are labeled in red. Multiple alignment was performed using the COBALT multiple alignment tool (http://blast.ncbi.nim.nih.gov) of the BLASTP program (76) relative to Homo sapiens. Of the 22 residues, those showing either identity or conservation within the acid / base side chain group are indicated by black stripe, whereas those not conserved are shown as an orange stripe. Additional species aligned included: Pongo pygmaeus (orangutan), Sus scrofa (pig), Bos taurus (cow), Oryctolagus cuniculus (rabit), Rattus norvegicus (rat), Mus musculus (mouse), Erinaceus europaeus (hedgehog), Anas platyrhynchos (duck), Gallus gallus (rooster), Xenopus (frog), Anguilla japonica (bony fish).

Similar articles

Cited by

References

    1. Tall AR, Yvan-Charvet L, Terasaka N, Pagler T, Wang N. Cell Metab. 2008;7:365–375. - PubMed
    1. Trigatti B, Rigotti A, Krieger M. Curr. Opin. Lipidol. 2000;11:123–131. - PubMed
    1. Assmann G, Gotto AM., Jr Circulation. 2004;109:III8–III14. - PubMed
    1. Barter PJ, Rye KA. Curr. Opin. Lipidol. 2006;17:399–403. - PubMed
    1. Rader DJ. Nat. Clin. Pract. Cardiovasc. Med. 2007;4:102–109. - PubMed

Publication types