

Octamer-binding factor 6 (Oct-6/Pou3f1) is induced by interferon and contributes to dsRNA-mediated transcriptional responses
- PMID: 20687925
- PMCID: PMC2924845
- DOI: 10.1186/1471-2121-11-61
Octamer-binding factor 6 (Oct-6/Pou3f1) is induced by interferon and contributes to dsRNA-mediated transcriptional responses
Abstract
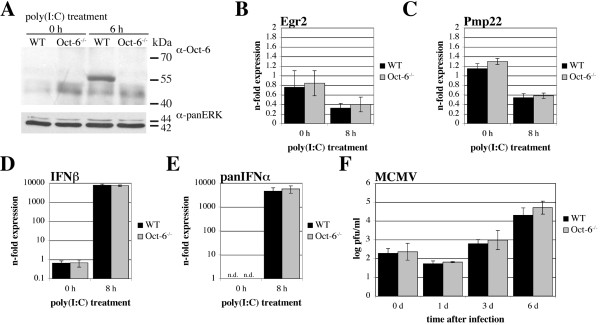
Background: Octamer-binding factor 6 (Oct-6, Pou3f1, SCIP, Tst-1) is a transcription factor of the Pit-Oct-Unc (POU) family. POU proteins regulate key developmental processes and have been identified from a diverse range of species. Oct-6 expression is described to be confined to the developing brain, Schwann cells, oligodendrocyte precursors, testes, and skin. Its function is primarily characterised in Schwann cells, where it is required for correctly timed transition to the myelinating state. In the present study, we report that Oct-6 is an interferon (IFN)-inducible protein and show for the first time expression in murine fibroblasts and macrophages.
Results: Oct-6 was induced by type I and type II IFN, but not by interleukin-6. Induction of Oct-6 after IFNbeta treatment was mainly dependent on signal transducer and activator of transcription 1 (Stat1) and partially on tyrosine kinase 2 (Tyk2). Chromatin immunopreciptitation experiments revealed binding of Stat1 to the Oct-6 promoter in a region around 500 bp upstream of the transcription start site, a region different from the downstream regulatory element involved in Schwann cell-specific Oct-6 expression. Oct-6 was also induced by dsRNA treatment and during viral infections, in both cases via autocrine/paracrine actions of IFNalpha/beta. Using microarray and RT-qPCR, we furthermore show that Oct-6 is involved in the regulation of transcriptional responses to dsRNA, in particular in the gene regulation of serine/threonine protein kinase 40 (Stk40) and U7 snRNA-associated Sm-like protein Lsm10 (Lsm10).
Conclusion: Our data show that Oct-6 expression is not as restricted as previously assumed. Induction of Oct-6 by IFNs and viruses in at least two different cell types, and involvement of Oct-6 in gene regulation after dsRNA treatment, suggest novel functions of Oct-6 in innate immune responses.
Figures


Similar articles
-
Signal regulatory protein alpha negatively regulates both TLR3 and cytoplasmic pathways in type I interferon induction.Mol Immunol. 2008 Jun;45(11):3025-35. doi: 10.1016/j.molimm.2008.03.012. Epub 2008 May 8. Mol Immunol. 2008. PMID: 18471880
-
Yin Yang 1 Dynamically Regulates Antiviral Innate Immune Responses During Viral Infection.Cell Physiol Biochem. 2017;44(2):607-617. doi: 10.1159/000485116. Epub 2017 Nov 20. Cell Physiol Biochem. 2017. PMID: 29161701
-
Identification of genes that are downregulated in the absence of the POU domain transcription factor pou3f1 (Oct-6, Tst-1, SCIP) in sciatic nerve.J Neurosci. 2002 Dec 1;22(23):10217-31. doi: 10.1523/JNEUROSCI.22-23-10217.2002. J Neurosci. 2002. PMID: 12451123 Free PMC article.
-
Long double-stranded RNA induces an antiviral response independent of IFN regulatory factor 3, IFN-beta promoter stimulator 1, and IFN.J Immunol. 2009 Nov 15;183(10):6545-53. doi: 10.4049/jimmunol.0900867. Epub 2009 Oct 28. J Immunol. 2009. PMID: 19864603 Free PMC article.
-
Non-Canonical Role of IKKα in the Regulation of STAT1 Phosphorylation in Antiviral Signaling.PLoS One. 2016 Dec 19;11(12):e0168696. doi: 10.1371/journal.pone.0168696. eCollection 2016. PLoS One. 2016. PMID: 27992555 Free PMC article.
Cited by
-
Functional dissection of the Oct6 Schwann cell enhancer reveals an essential role for dimeric Sox10 binding.J Neurosci. 2011 Jun 8;31(23):8585-94. doi: 10.1523/JNEUROSCI.0659-11.2011. J Neurosci. 2011. PMID: 21653862 Free PMC article.
-
Genomic expression analyses reveal lysosomal, innate immunity proteins, as disease correlates in murine models of a lysosomal storage disorder.PLoS One. 2012;7(10):e48273. doi: 10.1371/journal.pone.0048273. Epub 2012 Oct 19. PLoS One. 2012. PMID: 23094108 Free PMC article.
-
Chromatin accessibility variation provides insights into missing regulation underlying immune-mediated diseases.bioRxiv [Preprint]. 2025 Jul 3:2024.04.12.589213. doi: 10.1101/2024.04.12.589213. bioRxiv. 2025. PMID: 38659802 Free PMC article. Preprint.
-
Roles of macrophages on ulcerative colitis and colitis-associated colorectal cancer.Front Immunol. 2023 Mar 16;14:1103617. doi: 10.3389/fimmu.2023.1103617. eCollection 2023. Front Immunol. 2023. PMID: 37006260 Free PMC article. Review.
-
Transient upregulation of IRF1 during exit from naive pluripotency confers viral protection.EMBO Rep. 2022 Sep 5;23(9):e55375. doi: 10.15252/embr.202255375. Epub 2022 Jul 19. EMBO Rep. 2022. PMID: 35852463 Free PMC article.
References
Publication types
MeSH terms
Substances
Associated data
- Actions
Grants and funding
LinkOut - more resources
Full Text Sources
Medical
Molecular Biology Databases
Research Materials
Miscellaneous
