

Genome-wide DNA methylation analysis for diabetic nephropathy in type 1 diabetes mellitus
- PMID: 20687937
- PMCID: PMC2924253
- DOI: 10.1186/1755-8794-3-33
Genome-wide DNA methylation analysis for diabetic nephropathy in type 1 diabetes mellitus
Abstract
Background: Diabetic nephropathy is a serious complication of diabetes mellitus and is associated with considerable morbidity and high mortality. There is increasing evidence to suggest that dysregulation of the epigenome is involved in diabetic nephropathy. We assessed whether epigenetic modification of DNA methylation is associated with diabetic nephropathy in a case-control study of 192 Irish patients with type 1 diabetes mellitus (T1D). Cases had T1D and nephropathy whereas controls had T1D but no evidence of renal disease.
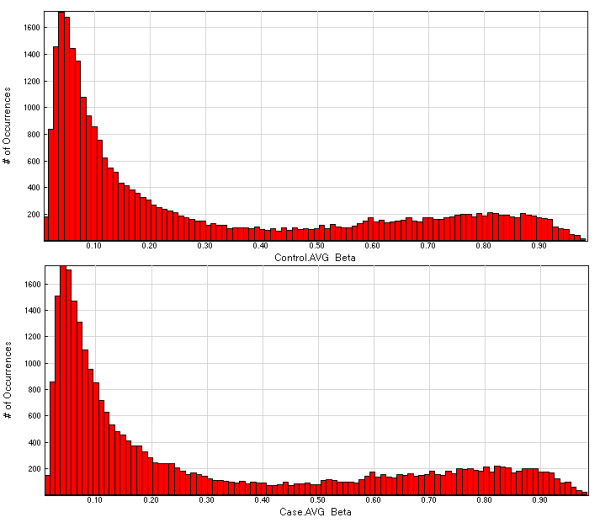
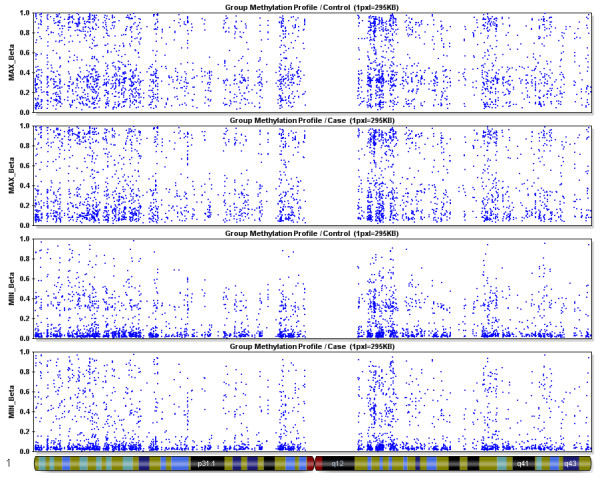
Methods: We performed DNA methylation profiling in bisulphite converted DNA from cases and controls using the recently developed Illumina Infinium HumanMethylation27 BeadChip, that enables the direct investigation of 27,578 individual cytosines at CpG loci throughout the genome, which are focused on the promoter regions of 14,495 genes.
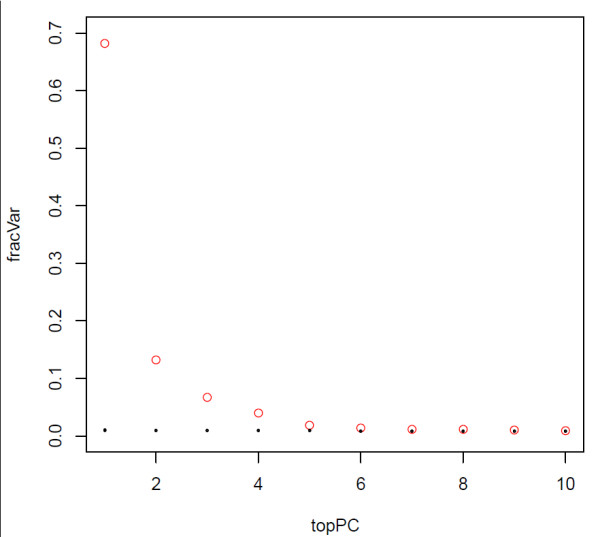
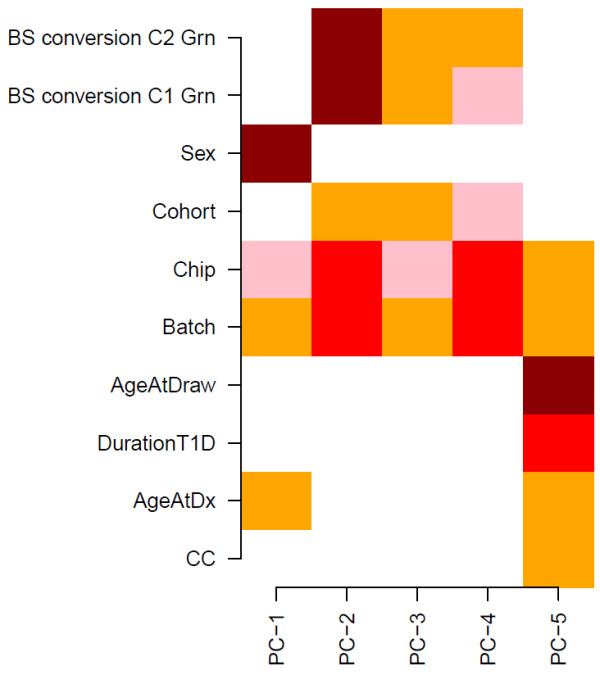
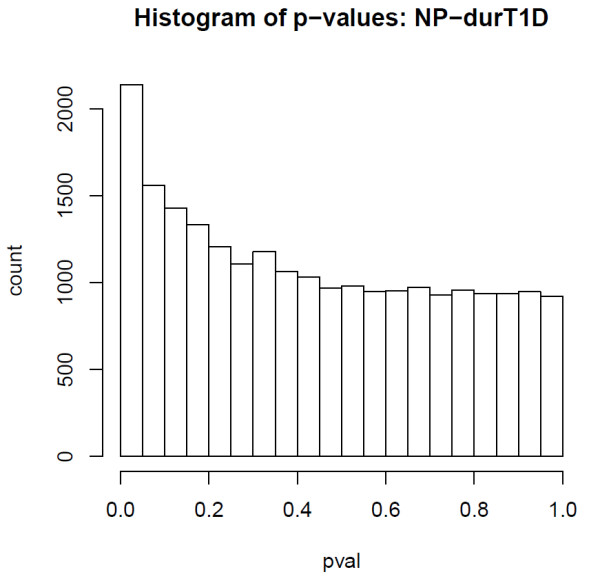
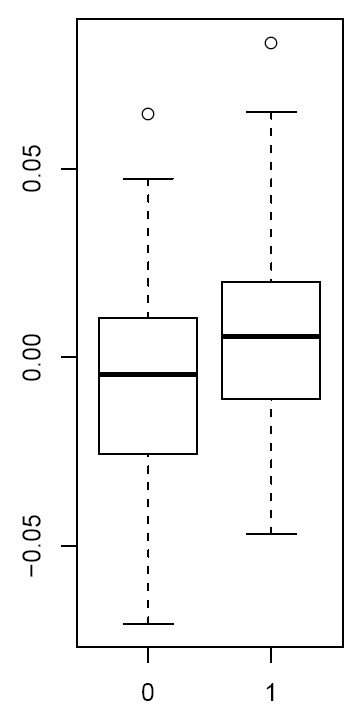
Results: Singular Value Decomposition (SVD) analysis indicated that significant components of DNA methylation variation correlated with patient age, time to onset of diabetic nephropathy, and sex. Adjusting for confounding factors using multivariate Cox-regression analyses, and with a false discovery rate (FDR) of 0.05, we observed 19 CpG sites that demonstrated correlations with time to development of diabetic nephropathy. Of note, this included one CpG site located 18 bp upstream of the transcription start site of UNC13B, a gene in which the first intronic SNP rs13293564 has recently been reported to be associated with diabetic nephropathy.
Conclusion: This high throughput platform was able to successfully interrogate the methylation state of individual cytosines and identified 19 prospective CpG sites associated with risk of diabetic nephropathy. These differences in DNA methylation are worthy of further follow-up in replication studies using larger cohorts of diabetic patients with and without nephropathy.
Figures
References
-
- Ansell D, Feehally J, Fogarty D, Tomsom CRV, Williams AJ, Warwick G. UK Renal Registry Annual Report. Bistol. 2008. 2009/06/30 edn.
-
- U.S Renal Data System. Atlas of Chronic Kidney Disease and End Stage Renal Disease in the United States. Bethesda, MD: National Institutes of Health, National Institutes of Diabetes and Digestive and Kidney Diseases; 2008. US Renal Data System 2008 Annual Data Report. (National Institutes of Health NIoDaDaKD.
-
- Ibrahim HN, Hostetter TH. Diabetic nephropathy. J Am Soc Nephrol. 1997;8:487–493. - PubMed
Publication types
MeSH terms
Substances
Grants and funding
LinkOut - more resources
Full Text Sources
Other Literature Sources
Medical
Molecular Biology Databases
