

Model-based extension of high-throughput to high-content data
- PMID: 20687942
- PMCID: PMC2928782
- DOI: 10.1186/1752-0509-4-106
Model-based extension of high-throughput to high-content data
Abstract
Background: High-quality quantitative data is a major limitation in systems biology. The experimental data used in systems biology can be assigned to one of the following categories: assays yielding average data of a cell population, high-content single cell measurements and high-throughput techniques generating single cell data for large cell populations. For modeling purposes, a combination of data from different categories is highly desirable in order to increase the number of observable species and processes and thereby maximize the identifiability of parameters.
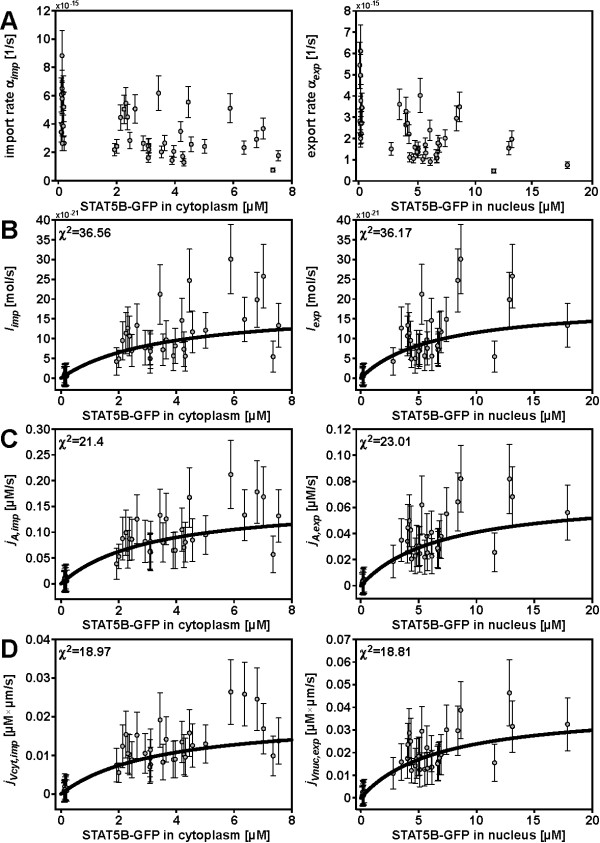
Results: In this article we present a method that combines the power of high-content single cell measurements with the efficiency of high-throughput techniques. A calibration on the basis of identical cell populations measured by both approaches connects the two techniques. We develop a mathematical model to relate quantities exclusively observable by high-content single cell techniques to those measurable with high-content as well as high-throughput methods. The latter are defined as free variables, while the variables measurable with only one technique are described in dependence of those. It is the combination of data calibration and model into a single method that makes it possible to determine quantities only accessible by single cell assays but using high-throughput techniques. As an example, we apply our approach to the nucleocytoplasmic transport of STAT5B in eukaryotic cells.
Conclusions: The presented procedure can be generally applied to systems that allow for dividing observables into sets of free quantities, which are easily measurable, and variables dependent on those. Hence, it extends the information content of high-throughput methods by incorporating data from high-content measurements.
Figures


Similar articles
-
A systems biology approach to analyse amplification in the JAK2-STAT5 signalling pathway.BMC Syst Biol. 2008 Apr 25;2:38. doi: 10.1186/1752-0509-2-38. BMC Syst Biol. 2008. PMID: 18439261 Free PMC article.
-
A system biology approach to understand functional activity of cell communication systems.Methods Cell Biol. 2008;90:399-415. doi: 10.1016/S0091-679X(08)00817-0. Methods Cell Biol. 2008. PMID: 19195559
-
Computational procedures for optimal experimental design in biological systems.IET Syst Biol. 2008 Jul;2(4):163-72. doi: 10.1049/iet-syb:20070069. IET Syst Biol. 2008. PMID: 18681746
-
Microfluidics in systems biology-hype or truly useful?Curr Opin Biotechnol. 2016 Jun;39:215-220. doi: 10.1016/j.copbio.2016.04.020. Curr Opin Biotechnol. 2016. PMID: 27267565 Free PMC article. Review.
-
Boolean modeling in systems biology: an overview of methodology and applications.Phys Biol. 2012 Oct;9(5):055001. doi: 10.1088/1478-3975/9/5/055001. Epub 2012 Sep 25. Phys Biol. 2012. PMID: 23011283 Review.
Cited by
-
The microtubule affinity regulating kinase MARK4 promotes axoneme extension during early ciliogenesis.J Cell Biol. 2013 Feb 18;200(4):505-22. doi: 10.1083/jcb.201206013. Epub 2013 Feb 11. J Cell Biol. 2013. PMID: 23400999 Free PMC article.
-
Cep164 mediates vesicular docking to the mother centriole during early steps of ciliogenesis.J Cell Biol. 2012 Dec 24;199(7):1083-101. doi: 10.1083/jcb.201202126. Epub 2012 Dec 17. J Cell Biol. 2012. PMID: 23253480 Free PMC article.
-
High-resolution time series of Pseudomonas aeruginosa gene expression and rhamnolipid secretion through growth curve synchronization.BMC Microbiol. 2011 Jun 17;11:140. doi: 10.1186/1471-2180-11-140. BMC Microbiol. 2011. PMID: 21682889 Free PMC article.
-
Disentangling molecular mechanisms regulating sensitization of interferon alpha signal transduction.Mol Syst Biol. 2020 Jul;16(7):e8955. doi: 10.15252/msb.20198955. Mol Syst Biol. 2020. PMID: 32696599 Free PMC article.
-
Cancer cell specific inhibition of Wnt/β-catenin signaling by forced intracellular acidification.Cell Discov. 2018 Jul 3;4:37. doi: 10.1038/s41421-018-0033-2. eCollection 2018. Cell Discov. 2018. PMID: 29977599 Free PMC article.
References
Publication types
MeSH terms
Substances
LinkOut - more resources
Full Text Sources
Research Materials
Miscellaneous
