. 2010 Aug 5:10:160.
doi: 10.1186/1471-2229-10-160.

RNA-Seq Atlas of Glycine max: a guide to the soybean transcriptome

Affiliations

RNA-Seq Atlas of Glycine max: a guide to the soybean transcriptome

Andrew J Severin et al. BMC Plant Biol. .

Abstract

Background: Next generation sequencing is transforming our understanding of transcriptomes. It can determine the expression level of transcripts with a dynamic range of over six orders of magnitude from multiple tissues, developmental stages or conditions. Patterns of gene expression provide insight into functions of genes with unknown annotation.

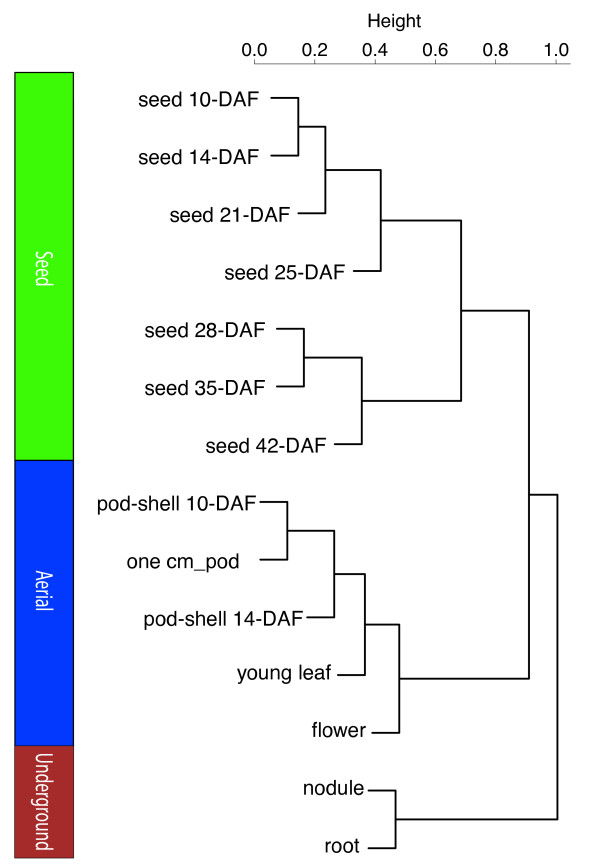
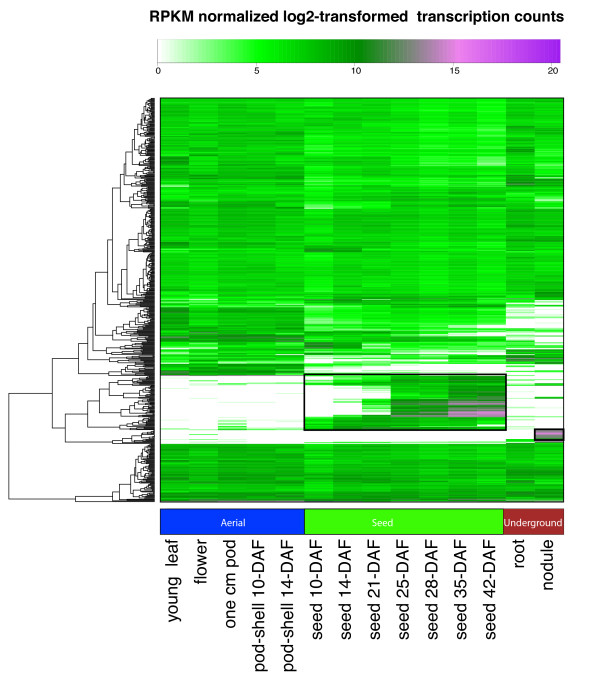
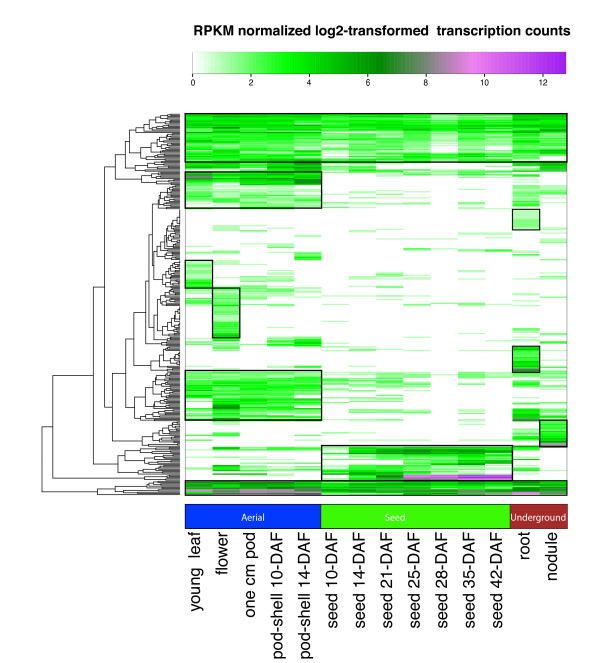
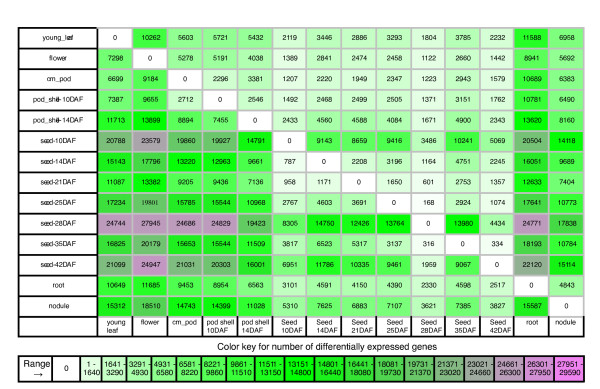
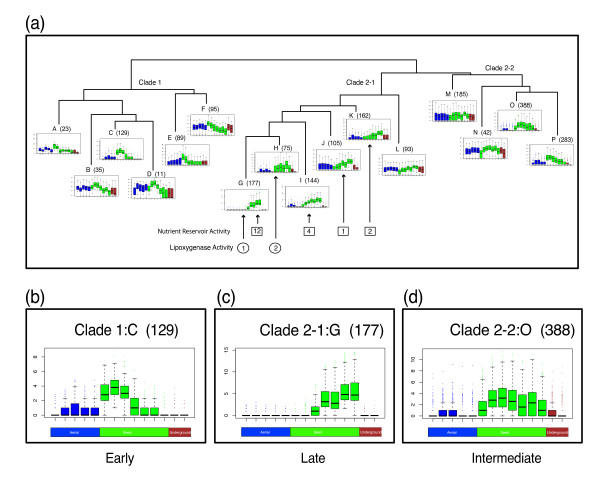
Results: The RNA Seq-Atlas presented here provides a record of high-resolution gene expression in a set of fourteen diverse tissues. Hierarchical clustering of transcriptional profiles for these tissues suggests three clades with similar profiles: aerial, underground and seed tissues. We also investigate the relationship between gene structure and gene expression and find a correlation between gene length and expression. Additionally, we find dramatic tissue-specific gene expression of both the most highly-expressed genes and the genes specific to legumes in seed development and nodule tissues. Analysis of the gene expression profiles of over 2,000 genes with preferential gene expression in seed suggests there are more than 177 genes with functional roles that are involved in the economically important seed filling process. Finally, the Seq-atlas also provides a means of evaluating existing gene model annotations for the Glycine max genome.

Conclusions: This RNA-Seq atlas extends the analyses of previous gene expression atlases performed using Affymetrix GeneChip technology and provides an example of new methods to accommodate the increase in transcriptome data obtained from next generation sequencing. Data contained within this RNA-Seq atlas of Glycine max can be explored at http://www.soybase.org/soyseq.


Figures

Figure 1
Figure 1
Hierarchical clustering of transcriptional profiles in 14 tissues. Hierarchical clustering analysis of the transcriptional profiles was performed using the hclust command in R [39] and the default complete linkage method. The analysis reveals three clades of tissues with similar transcriptional profiles: underground, aerial and seed.
Figure 2
Figure 2
Relative expression levels based on Z-score analysis. (a) Relative expression levels in early seed development stages (seed 10-DAF, seed 14-DAF and seed 21-DAF, (b) late seed development stages (seed 25-DAF, seed 28-DAF, seed 35-DAF and seed 42-DAF, (c) aerial tissues (leaf, flower, pod, pod-shell 10-DAF and pod-shell 14-DAF, and (d) underground tissues (root and nodule) were visualized using a Z-score plot. High Z-score values indicate genes with tissue specificity.
Figure 3
Figure 3
Heatmap of the top 500 highest expressed genes. The color key represents RPKM normalized log2 transformed counts. Violet indicates high expression, green indicates intermediate expression and white indicates no expression. It is straightforward to identify highly expressed genes in specific tissues from this figure. Tissues are labeled with Days After Flowering (DAF) where appropriate.
Figure 4
Figure 4
Heatmap of the Legume Specific Genes. The color key represents RPKM normalized log2 transformed counts of 315 legume specific genes. Violet indicates high expression, green indicates intermediate expression and white indicates no expression. The heatmap suggests some legume specific genes have tissue specific transcription. Tissues are labeled with Days After Flowering (DAF) as appropriate.
Figure 5
Figure 5
Tissue by tissue comparison. This figure shows the total number of genes with a significant increase in gene expression between the row tissue (left) and the column tissue (bottom). For the genes reported in each cell, there is more transcriptional activity in the column tissue than the row tissue. For example, there are 7,298 genes that have a higher transcriptional activity in young leaf than in flower. Also, there are 10,262 genes that have a higher transcriptional activity in flower than in young leaf. These two statements are mutually exclusive and therefore each cell represents a different set of genes.
Figure 6
Figure 6
Boxplot Dendrogram of preferential expressed genes in seed development. Combination plot of the hierarchical clustering of the genes preferentially expressed in seed stages of development and the RPKM normalized log2-transformed expression profiles for the genes in specified subclades represented as a boxplots of each tissue. Boxes contain the number of genes with the GOslim molecular function of nutrient reservoir activity. Circles contain the number of genes with the GOslim molecular function of lipoxygenase activity. Arrows indicate which subclade the specified genes belong. (a) Overview of the clade structure that resulted from the hierarchical clustering analysis is shown. Numbers in parenthesis next to subclades indicates the number of genes represented in the subclade. (b, c, d) Enlarged boxplots of subclades that represent the three main clades defined in the overview as clade 1, clade 2-1 and clade 2-2 are shown. Aerial (leaf, flower, pod, pod-shell 10-DAF and pod-shell 14-DAF), seed (seed 10-DAF, seed 14-DAF, seed 21-DAF, seed 25-DAF, seed 28-DAF, seed 35-DAF, and seed 42-DAF) and underground tissues (root and nodule) are represented in color for each boxplot as blue, green and red respectively.

References

    1. Shoemaker RC, Polzin K, Labate J, Specht J, Brummer EC, Olson T, Young N, Concibido V, Wilcox J, Tamulonis JP, Kochert G, Boerma HR. Genome duplication in soybean (Glycine subgenus soja) Genetics. 1996;144:329–338. - PMC - PubMed
    1. Blanc G, Wolfe KH. Functional divergence of duplicated genes formed by polyploidy during Arabidopsis evolution. Plant Cell. 2004;16(7):1647–1649. doi: 10.1105/tpc.160710. - DOI - PMC - PubMed
    1. Schleueter J, Dixon P, Granger C, Grant D, Clark L, Doyle JJ, Shoemaker RC. Mining EST databases to resolve evolutionary events in major crop species. Genome. 2004;47(5):868–876. doi: 10.1139/g04-047. - DOI - PubMed
    1. Lynch M, Conery JS. The evolutionary fate and consequences of duplicate genes. Science. 2000;290:1151–1155. doi: 10.1126/science.290.5494.1151. - DOI - PubMed
    1. Kondrashov F, Rogozin IB, Wolf YI, Koonin EV. Selection in the evolution of gene duplications. Genome Biol. 2002;3(2):8.1–8.9. doi: 10.1186/gb-2002-3-2-research0008. - DOI - PMC - PubMed

Publication types

LinkOut - more resources