. 2010 Aug 5:9:210.
doi: 10.1186/1476-4598-9-210.

Brg-1 mediates the constitutive and fenretinide-induced expression of SPARC in mammary carcinoma cells via its interaction with transcription factor Sp1

Affiliations

Brg-1 mediates the constitutive and fenretinide-induced expression of SPARC in mammary carcinoma cells via its interaction with transcription factor Sp1

Yong Zhong Xu et al. Mol Cancer. .

Abstract

Background: Secreted protein, acidic and rich in cysteine (SPARC) is a matricellular protein that mediates cell-matrix interactions. It has been shown, depending on the type of cancer, to possess either pro- or anti-tumorigenic properties. The transcriptional regulation of the SPARC gene expression has not been fully elucidated and the effects of anti-cancer drugs on this process have not been explored.

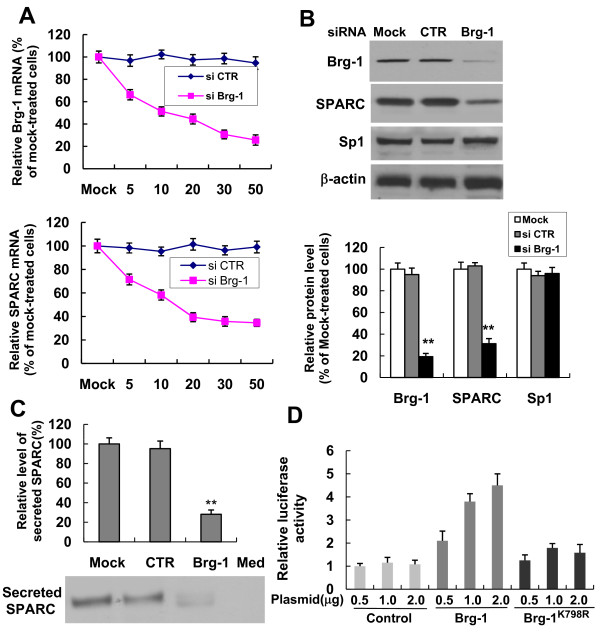
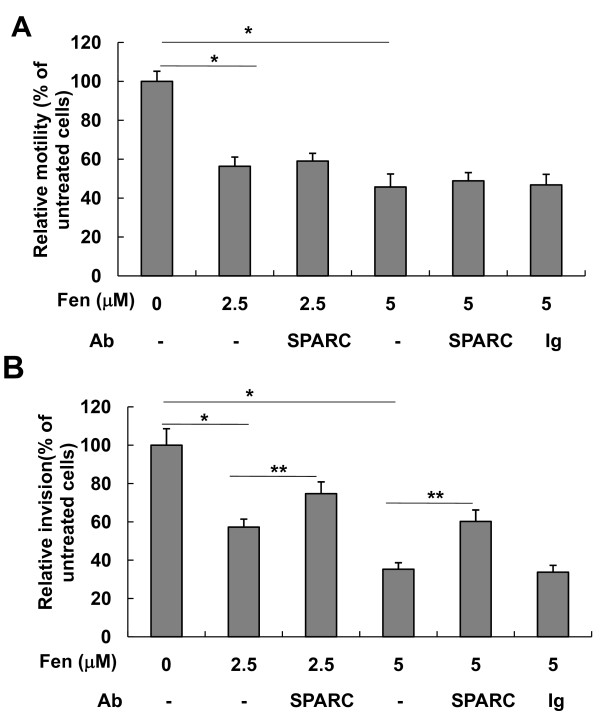
Results: In the present study, we demonstrated that chromatin remodeling factor Brg-1 is recruited to the proximal SPARC promoter region (-130/-56) through an interaction with transcription factor Sp1. We identified Brg-1 as a critical regulator for the constitutive expression levels of SPARC mRNA and protein in mammary carcinoma cell lines and for SPARC secretion into culture media. Furthermore, we found that Brg-1 cooperates with Sp1 to enhance SPARC promoter activity. Interestingly, fenretinide [N-4(hydroxyphenyl) retinamide, 4-HPR], a synthetic retinoid with anti-cancer properties, was found to up-regulate the transcription, expression and secretion of SPARC via induction of the Brg-1 in a dose-dependent manner. Finally, our results demonstrated that fenretinide-induced expression of SPARC contributes significantly to a decreased invasion of mammary carcinoma cells.

Conclusions: Overall, our results reveal a novel cooperative role of Brg-1 and Sp1 in mediating the constitutive and fenretinide-induced expression of SPARC, and provide new insights for the understanding of the anti-cancer effects of fenretinide.


Figures

Figure 1
Figure 1
Sp1 and Brg-1 are bound to the SPARC promoter in tumor cell lines. (A) Nucleotide sequence (from - 201 to +19) indicating the position of six GGAGG boxes (underlined) in the mouse SPARC promoter. (B) Nuclear extracts were prepared from 4T1, 168FARN and 67NR cells. Proteins which bind to probe a (spanning GGAGG-rich nucleotides -130/-56) or probe b (spanning nucleotides -50/+19) were isolated from the nuclear extracts using the immobilized-template assay and then subjected to Western blot analysis with antibodies against Brg-1, Sp1 or p38. p38 and the probe b were used to serve as a non-specific binding control (right panel). Unpurified total nuclear extracts were also subjected to Western blot analysis and probed with the same antibodies (left panel). (C) Cross-linked and sonicated chromatin samples were prepared from 4T1, 168FARN and 67NR cells. ChIP assays were performed using antibodies against Sp1, Brg-1 or non-specific rabbit IgG as a control. Immunoprecipitated DNA and serially diluted input genomic DNA was amplified with primers specific to the SPARC promoter. PCR products were then analyzed using 2.0% agarose gels and stained with ethidium bromide. The illustrated results are representative of three independent experiments. (D) The ChIP DNA and input genomic DNA from (C) were quantified and amplified by real-time qPCR as described in the Materials and Methods section. The occupancy level of Brg-1 or Sp1 at the SPARC promoter is represented as the ratio of signal from IP samples versus that of the input minus background of IgG control. The relative occupancy level of Brg-1 or Sp1 in 4T1 cells is set as 1. Data represented as mean ± SEM (n = 3).
Figure 2
Figure 2
Sp1 mediates the recruitment of Brg-1 to the proximal region of the SPARC gene. 4T1 cells were transfected with mock (transfection reagent only), siRNA control (CTR), or siRNA specific for Sp1, and then cultured for 72 hrs prior to harvesting the cells. (A) Total cell extracts were prepared from transfected cells, and protein expression was analyzed by Western blotting using antibodies specific to Sp1, Brg-1 or p38. (B) Nuclear extracts were prepared and the binding reactions of Sp1, Brg-1 or p38 to the probe a were analyzed using the immobilized-template assay followed by Western blot analysis. (C) Cells were cross-linked and sonicated, and ChIP assay was performed. The precipitated DNAs and input DNA were quantified and then amplified using real-time qPCR. The occupancy level of Brg-1 at the SPARC promoter is calculated as described in Figure 1 D. The relative occupancy level of Brg-1 in mock-treated cells is set as 100%. Data represented as mean ± SEM (n = 3).
Figure 3
Figure 3
Brg-1 and Sp1 are components of the same nuclear complexes. (A) Nuclear extracts from 4T1, 168FARN and 67NR cells were immunoprecipitated (IP) using Brg-1 antibodies or rabbit IgG (control). The immunoprecipitates were subjected to SDS/PAGE gel followed by Western blot analysis using antibodies against Sp1 and Brg-1. (B) The co-immunoprecipitation assay was carried out by using Sp1 antibody or rabbit IgG for the IP and Brg-1 or SP1 antibodies for the Western blot analysis. (C) 4T1, 168FARN and 67NR cells were cross-linked and subjected to sonication and immunoprecipitation with the indicated antibodies. ChIP was first carried out using the Sp1 antibody, and the immunocomplexes were eluted using 10 mM dithiothreitol. The aliquots of the diluted elution were immunoprecipitated with Brg-1, or non- specific IgG as a control. The precipitated DNA fragments were amplified by PCR using the primers specific to the SPARC promoter region containing GGAGG repeats (spanning nucleotides -201/-23). The illustrated results are representative of three independent experiments.
Figure 4
Figure 4
Brg-1 is required for SPARC gene expression. RNA interference- mediated depletion of Brg-1 reduces SPARC expression. 4T1 cells were transfected with mock, siRNA control or different concentrations of siRNA targeting Brg-1[0(mock)-50 nM] and were then cultured for another 48 hrs prior to harvesting the cells. (A) Total RNA was isolated from transfected 4T1 cells and mRNA levels of Brg-1 and SPARC were analyzed using real-time RT-qPCR. The relative mRNA level of Brg-1 or SPARC was represented as a percentage of the Brg-1 or SPARC mRNA level in mock-treated 4T1 cells (data shown are mean ± SEM, n = 4). (B) Total cell extracts were prepared from siRNA-transfected (30 nM) or mock-transfected 4T1 cells. Western blot analysis was performed to assess the protein expression levels of Brg-1, SPARC, Sp1 and β-actin (upper panel). Quantification of the protein expression of Brg-1, SPARC and Sp1 (data shown are mean ± SEM, n = 3) (bottom panel). **P < 0.001, compared with mock-treated cells. (C) Conditioned media were collected from siRNA-transfected (30 nM) or mock-transfected 4T1 cells, and the levels of secreted SPARC were assessed by Western blot analysis. Cell-free medium (Med) was used as a control. Densitometric quantitation was performed and results were adjusted for total protein content of cell lysate (densitometry/μg cell total protein). The relative level of secreted SPARC in the medium of mock-transfected 4T1 cells is set as 100%. Data represented as mean ± SEM (n = 3). (D) Overexpression of Brg-1 enhances the SPARC promoter-driven reporter gene transcription. 4T1 cells were co-transfected with the luciferase reporter vector pREP4-SP-Luc and expression plasmids encoding Brg-1 or its mutant (Brg-1K798R) or empty plasmids (control). Cell lysates were prepared 48 hrs after transfection and assayed for luciferase activity. Luciferase relative activity is expressed as a fold of the luciferase activity of the cells untransfected with Brg-1. The data shown (mean ± SEM) are the averages of three independent experiments performed in triplicate.
Figure 5
Figure 5
Inhibition of endogenous Sp1 protein decreased the Brg-1-mediated transcriptional activation of the SPARC gene. 4T1 cells were respectively transfected with siRNA control (-) or siRNAs specific for Sp1 (+). 24 hrs after transfection, the luciferase reporter construct pREP4-SP-luc was co-transfected with Brg-1 expression plasmid or empty plasmid (control) into 4T1 cells. Cell lysates were prepared 48 hrs after the second transfection. (A) The luciferase activity was analyzed. The data shown (mean ± SEM) are the averages of three independent experiments performed in triplicate. (B) Protein expression levels of Sp1, Brg-1 and β-actin (internal control) in transfected 4T1 cells were assessed using Western blot analysis. The illustrated result is a representative of three independent experiments.
Figure 6
Figure 6
Analyses of SPARC expression and secretion from mammary tumor cell lines with different metastatic capacities. Cells were seeded into 6-well plates at a density of 1 × 10⁵ cells (4T1 or 168FARN) or 1.5 × 10⁵ cells (67NR) per well and cultured at 37°C. Cell-free medium served as a control. Seventy-two hrs after culture, cell media were collected, and total RNA as well as protein extracts were prepared from the three cell lines. (A) Real-time qRT-PCR was used to analyze the relative expression of SPARC mRNA level. The SPARC mRNA was normalized by GAPDH expression and the relative expression level is represented as a fold of the SPARC mRNA level in 4T1 cells. (Data represented as mean ± SEM, n = 4). *P < 0.01, compared with 4T1; **P < 0.01, compared with 168FARN. (B) Cellular SPARC protein expression was assessed using Western blot analysis. The illustrated result is a representative of three independent experiments. (C) The levels of secreted SPARC protein in the culture media were assessed by Western blot analysis. Cell-free medium (Med) was used as a control. Densitometric quantitation was performed and results were adjusted for total protein content of cell lysate (densitometry/μg cell total protein). The relative level of secreted SPARC in the medium of 4T1 cells is set as 1. Data represented as mean ± SEM (n = 3). *P < 0.01, compared with 4T1; **P < 0.01, compared with 168FARN.
Figure 7
Figure 7
Fenretinide treatment increases SPARC expression and secretion from mammary carcinoma cells. 4T1, 168FARN or 67NR cells were treated with various concentrations of fenretinide (1.25 μM, 2.5 μM and 5 μM) or left untreated (control) for 24 hrs. (A) Total RNA was isolated from different cell lines and SPARC mRNA level was analyzed using real-time RT-qPCR. Experiments were conducted in quadruplicate and normalized to GAPDH mRNA level. The relative SPARC mRNA level is represented as a fold of the SPARC mRNA level in untreated cells (data shown are mean ± SEM, n = 4). Compared with control, *P < 0.05, **P < 0.01, ***P < 0.001. (B) Total protein extracts were prepared from different cell lines and expression of SPARC protein levels were assessed using Western blot analysis. Expression of β-actin was used as an internal control. (C) Conditioned media were collected from 4T1 (left panel) and 67NR (right panel) cell lines and the levels of secreted SPARC protein were assessed by Western blot analysis. Densitometric quantitation was performed and results were adjusted for total protein content of cell lysate (densitometry/μg cell total protein). The relative level of secreted SPARC in the medium of untreated cells is set as 1. Data represented as mean ± SEM (n = 3). Compared with control, ***P < 0.001. (D) Effect of fenretinide treatment on the transcriptional activity of the SPARC promoter. 4T1, 168FARN and 67NR cells were transiently co-transfected with the luciferase reporter vector pREP4-SP-Luc and pRL-CMV. The pRL-CMV reporter was used as an internal control. 24 hrs after transfection of plasmids, cells were cultured for 24 hrs with or without different concentrations of fenretinide, and the luciferase activity was analyzed by the dual-luciferase reporter assay system. Luciferase relative activity is presented as a fold of the luciferase activity of the cells without fenretinide treatment. The data shown (mean ± SEM) represent the averages of three independent experiments performed in triplicate.
Figure 8
Figure 8
Fenretinide induces the expression of Brg-1, Brg-1 and Sp1 complex formation and the binding of Brg-1 to SPARC promoter. 4T1, 168FARN or 67NR cells were left untreated (control) or treated with the indicated doses of fenretinide for 24 hrs. Cell lysates were prepared, and assessed by Western blot analysis for Brg-1 (A) and Sp1 (B), respectively. Expression of β-actin was detected as an internal control. (C) Nuclear extracts from fenretinide-treated 4T1 cells were immunoprecipitated (IP) with antibodies against Sp1 or IgG (control). The precipitated protein complexes were subjected to SDS/PAGE and analyzed by Western blot analysis with an antibody against Brg-1 or Sp1. (D) Cross-linked chromatin derived from either fenretinide-treated or untreated 4T1 cells was immunoprecipitated with Brg-1or Sp1 antibodies or nonspecific IgG. The precipitated DNAs or input DNA were analyzed by real-time qPCR with the specific primers for the region from -201 to -23 nucleotides of the SPARC promoter. The relative occupancy level of Brg-1 or Sp1 in untreated 4T1 cells (CTR) was set as 1. Data shown are mean ± SEM (n = 3)
Figure 9
Figure 9
Fenretinide-induced transactivation and expression of SPARC depend on Brg-1. 4T1, 168FARN or 67NR cells were respectively transfected with siRNA control (-) or siRNA specific for Brg-1 (+). 24 hrs after transfection, cells were transiently co-transfected again with the luciferase reporter vector pREP4-SP-Luc and pRL-CMV. 6 hrs after the second transfection, cells were cultured for 24 hrs with or without fenretinide (5 μM). Total protein extracts were prepared. (A) The luciferase activities were analyzed by the dual-luciferase reporter assay system. (B) Expression of SPARC and Brg-1 proteins were analyzed using Western blot analysis. β-actin was analyzed as a control. (C) Cells were transfected with Brg-1 siRNA or control siRNA for 24 hrs and then treated with fenretinide for 24 hrs. Total RNA was extracted and expression of SPARC mRNA levels was measured by real-time RT-qPCR. Experiments were conducted in quadruplicate and normalized to GAPDH mRNA level. The relative SPARC mRNA level in control siRNA-treated cells is set as 100% (data shown are mean ± SEM, n = 4, **P < 0.001)
Figure 10
Figure 10
SPARC is a mediator for fenretinide inhibiting cell invasion but not cell motility. (A) Cell motility was analyzed by in vitro wound assay. 4T1 cells were grown on 24-well culture plates overnight and were then left untreated or pretreated with 2.5 μM or 5.0 μM fenretinide for 6 hrs. The confluent cell monolayers were gently scratched with a pipette tip to produce a wound. After wash, the cells were cultured in medium containing different combinations of fenretinide with anti-SPARC antibodies. Quantitative analysis was performed 18 hrs later, as described in the Materials and Methods section. Data shown are means ± SEM. *P < 0.01. (B) In vitro invasion assay was performed using 24-well trans-well units with polycarbonate filters (pore size 8 μm) coated on the upper side with ECMatrix™. Cells pretreated or untreated with fenretinide for 6 hrs were collected, and 5 × 10⁴ cells in 0.3 ml of serum-free medium with different combinations of fenretinide with anti-SPARC antibodies were placed in the upper part of the trans-well unit and allowed to invade for 24 hrs. The lower chamber of the plate was filled with medium containing 10% FBS. The relative invasion of cells cultured in medium without fenretinide and anti-SPARC antibodies was considered as 100%. Results from three independent experiments were expressed as mean ± SEM. *P < 0.01, compared with untreated cells. **P < 0.01, compared with cells treated with fenretinide alone.

Similar articles

Cited by

References

    1. Brekken RA, Sage EH. SPARC, a matricellular protein: at the crossroads of cell-matrix. Matrix Biol. 2000;19:569–580. doi: 10.1016/S0945-053X(00)00105-0. - DOI - PubMed
    1. Lane TF, Sage EH. The biology of SPARC, a protein that modulates cell-matrix interactions. FASEB J. 1994;8:163–173. - PubMed
    1. Framson PE, Sage EH. SPARC and tumor growth: where the seed meets the soil? J Cell Biochem. 2004;92:679–690. doi: 10.1002/jcb.20091. - DOI - PubMed
    1. Podhajcer OL, Benedetti LG, Girotti MR, Prada F, Salvatierra E, Llera AS. The role of the matricellular protein SPARC in the dynamic interaction between the tumor and the host. Cancer Metastasis Rev. 2008;27:691–705. doi: 10.1007/s10555-008-9146-7. - DOI - PubMed
    1. Bergamaschi A, Tagliabue E, Sorlie T, Naume B, Triulzi T, Orlandi R. Extracellular matrix signature identifies breast cancer subgroups with different clinical outcome. J Pathol. 2008;214:357–367. doi: 10.1002/path.2278. - DOI - PubMed

Publication types

MeSH terms

LinkOut - more resources