Comparative Study
. 2010 Dec 6;28(52):8315-26.
doi: 10.1016/j.vaccine.2010.07.070. Epub 2010 Aug 3.

High-throughput automated image analysis of neuroinflammation and neurodegeneration enables quantitative assessment of virus neurovirulence

Affiliations
Comparative Study

High-throughput automated image analysis of neuroinflammation and neurodegeneration enables quantitative assessment of virus neurovirulence

Olga A Maximova et al. Vaccine. .

Abstract

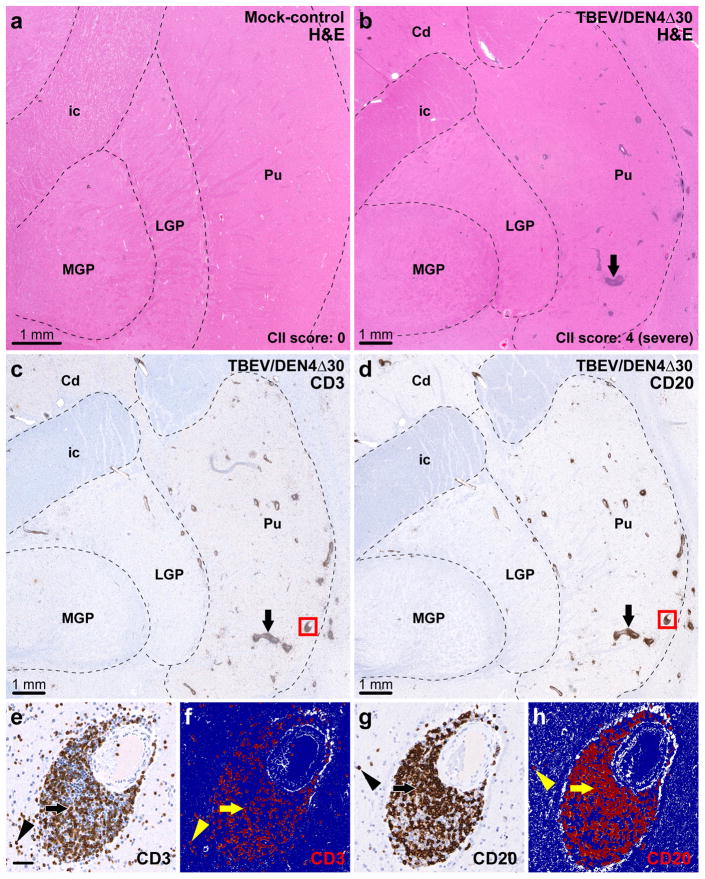
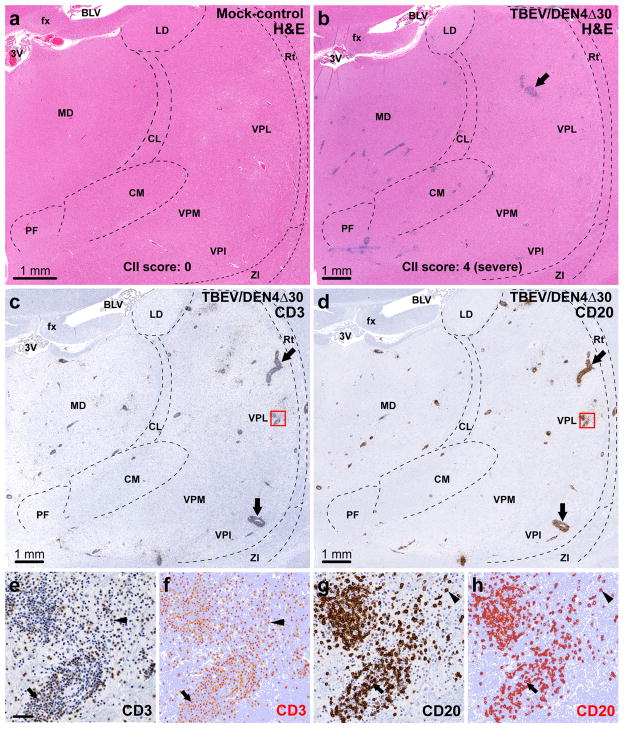
Historically, the safety of live attenuated vaccine candidates against neurotropic viruses was assessed by semi-quantitative analysis of virus-induced histopathology in the central nervous system of monkeys. We have developed a high-throughput automated image analysis (AIA) for the quantitative assessment of virus-induced neuroinflammation and neurodegeneration. Evaluation of the results generated by AIA showed that quantitative estimates of lymphocytic infiltration, microglial activation, and neurodegeneration strongly and significantly correlated with results of traditional histopathological scoring. In addition, we show that AIA is a targeted, objective, accurate, and time-efficient approach that provides reliable differentiation of virus neurovirulence. As such, it may become a useful tool in establishing consistent analytical standards across research and development laboratories and regulatory agencies, and may improve the safety evaluation of live virus vaccines. The implementation of this high-throughput AIA will markedly advance many fields of research including virology, neuroinflammation, neuroscience, and vaccinology.


Conflict of interest statement

Conflict of interest statement: The authors do not have a conflict of financial or other interest.

Figures

Fig. 1
Fig. 1
Assessment of lymphocytic infiltration in the basal ganglia. (a) Representative section through the basal ganglia of a mock-inoculated monkey (H&E staining). (b–d) Adjacent sections through the basal ganglia of a TBEV/DEN4Δ30-infected monkey (CII score: 4, severe). The dashed lines in (a–d) show approximate boundaries of the basal ganglia visible in the sections. (b) H&E staining showing perivascular inflammatory infiltrates. (c) Infiltration by T cells as revealed by CD3-immunostaining. (d) Infiltration by B cells as revealed by CD20-immunostaining. Arrows in (b–d): large perivascular inflammatory infiltrates. (e–h) Original and corresponding markup images of the same blood vessel and surrounding parenchyma (red boxes in c and d) are shown at higher magnification. The results of applied CD3-IR or CD20-IR algorithms are shown in the markup images (f and h, respectively) where the positive pixels appear in red, negative pixels appear in dark blue, and neutral pixels (neither positive nor negative) appear in white. (e and f) CD3-immunoreactivity within the perivascular space (arrows) and parenchyma (arrowheads). (g and h) CD20-immunoreactivity within the perivascular space (arrows) and parenchyma (arrowheads). Abbreviations: Cd, caudate nucleus; ic, internal capsule; MGP, medial globus pallidus; LGP, lateral globus pallidus; Pu, putamen. Bar in (e) (50 μm) also applies to (f–h).
Fig. 2
Fig. 2
Assessment of lymphocytic infiltration in the thalamus. (a) Representative section through the thalamus of a mock-inoculated monkey (H&E staining). (b–d) Adjacent sections through the thalamus of a TBEV/DEN4Δ30-infected monkey (CII score: 4, severe). The dashed lines in (a–d) show approximate boundaries of the thalamic nuclei present in the sections. (b) H&E staining showing perivascular inflammatory infiltrates. (c) Infiltration by T cells (CD3-immunostaining). (d) Infiltration by B cells (CD20-immunostaining). Arrows in (b–d): large perivascular inflammatory infiltrates. (e–h) Original and corresponding markup images of the boxed areas in (c and d) are shown at higher magnification. The results of applied CD3 or CD20-IR algorithms are shown in the markup images (f and h, respectively) where the positive pixels appear in orange-red, negative pixels appear in light blue, and neutral pixels appear in white. (e and f) CD3-IR within the perivascular inflammatory infiltrate (arrows) and parenchyma (arrowheads). (g and h) CD20-IR within the perivascular inflammatory infiltrate (arrows) and parenchyma (arrowheads). Abbreviations: 3V, third ventricle; fx, fornix; BLV, body of lateral ventricle; LD, lateral dorsal nucleus; MD, medial dorsal nucleus; CL, central lateral nucleus; VPL, ventral posterolateral nucleus; Rt, reticular nucleus; PF, parafascicular nucleus; CM, centromedian nucleus; VPM, ventral posteromedial nucleus; VPI, ventral posteroinferior nucleus; ZI, zona incerta. Bar in (e) (50 μm) also applies to f–h.
Fig. 3
Fig. 3
Analysis of correlation between CD3-IR, CD20-IR, or pooled CD3/CD20-IR and histopathological scores for cellular inflammatory infiltration (CII) in the CNS. Correlation between CD3-IR (a–c), CD20-IR (d–f), or pooled CD3/CD20-IR (g–i) and CII scores in the basal ganglia, thalamus, and spinal cord of mock-control monkey (green; n = 1) and monkeys infected with TBEV/DEN4Δ30 (red; n = 3), LGTV (blue; n = 4), or YF 17D (yellow; n = 4). The trend line, correlation coefficient (R), and P-value are shown in each plot. CII scores and IR values did not differ statistically between the viruses unless specifically noted. The statistically significant differences between the viruses based on mean CII scores are indicated with one asterisk and based on mean IR values are indicated with two asterisks (P < 0.05).
Fig. 4
Fig. 4
Assessment of microglial activation and neuronal degeneration in the basal ganglia and thalamus. Adjacent sections through the basal ganglia (a and b) and thalamus (c and d) of a YF 17D-infected monkey showing immunostaining for CD68 (a and c) or NeuN (b and d). The circled areas in (a–d) are shown at higher magnification in corresponding insets. Insets in (a and c) show CD68-immunoreactive activated microglia engulfing or in close contact with degenerating neurons (red arrowheads). Insets in (b and d) show degenerating neurons with eccentric nuclei and/or shrunken cytoplasm and decreased intensity of the NeuN signal (red arrowheads). Abbreviations: MGP, medial globus pallidus; LGP, lateral globus pallidus; Pu, putamen; 3V, third ventricle; fx, fornix; BLV, body of lateral ventricle; Cd, caudate nucleus; AV, anteroventral nucleus; AM, anteromedial nucleus; VL, ventral lateral nucleus; VAMC, magnocellular part of ventral anterior nucleus; Rt, reticular nucleus; ic, internal capsule; ZI, zona incerta. Inset bars: 50 μm.
Fig. 5
Fig. 5
Image analysis of microglial activation (CD68-IR) and neurodegeneration (NeuN-IR) in the spinal cord. Adjacent transverse sections of the lumbar spinal cord of a mock-inoculated monkey (a and b) or LGTV-infected monkey (c and d) showing the analysis of CD68-IR (a and c) or NeuN-IR (b and d). The dashed lines show the approximate boundaries of the grey matter. The circled areas in (a–d) show the ventrolateral column containing motor neurons. The corresponding insets in (a–d) show the circled areas at higher magnification. Additional smaller insets in (a–d) represent markup images with applied CD68-IR or NeuN-IR algorithm (strong positive pixels, red; moderate positive pixels, orange; weak positive pixels, yellow; negative pixels, blue; neutral pixels, white). Note the CD68-IR surrounding degenerating neurons (black or green arrowheads in insets in c) and absence of CD68-IR in (a). Black arrowheads in (a) show normal motor neurons. Asterisks in (a and c) show the position of the corresponding neurons in the markup images. Note the strong NeuN-IR in the normal neurons (black or green arrowheads in b) and decreased number of neurons in (d). NeuN-IR in the remaining neurons is decreased or absent (black or green arrowheads in d). Abbreviations: Dh, dorsal horn; Vh, ventral horn. Bar in (a) also applies to (b–d); inset bars: 50 μm.
Fig. 6
Fig. 6
Analysis of correlation between CD68-IR and NeuN-IR and histopathological scores for microglial activation/neuronal degeneration (MGA/ND) in the CNS. Correlation between CD68-IR (a–c) or NeuN-IR (d–f) and MGA/ND scores in the basal ganglia, thalamus, and spinal cord of mock-inoculated control monkey (green; n = 1) and monkeys infected with TBEV/DEN4Δ30 (red; n = 3), LGTV (blue; n = 4), or YF 17D (yellow; n = 4). (g–i) Correlation between NeuN-IR and CD68-IR. The trend line, correlation coefficient (R), and P-value are shown in each plot. MGA/ND scores and IR values did not differ statistically between the viruses unless specifically noted. The statistically significant differences between the viruses based on mean MGA/ND scores are indicated with one asterisk and based on mean CD68-IR or NeuN-IR are indicated with two asterisks (P < 0.05).

Similar articles

Cited by

References

    1. Afzal MA, Marsden SA, Hull RM, Pipkin PA, Bentley ML, Minor PD. Evaluation of the neurovirulence test for mumps vaccines. Biologicals. 1999;27:43–9. - PubMed
    1. Rubin SA, Snoy PJ, Wright KE, Brown EG, Reeve P, Beeler JA, et al. The mumps virus neurovirulence safety test in Rhesus monkeys: a comparison of mumps virus strains. J Infect Dis. 1999;180:521–5. - PubMed
    1. WHO. Final report. IABS Scientific Workshop on Neurovirulence Tests for Live Virus Vaccines. Geneva, Switzerland: WHO; 2005. pp. 1–7. - PubMed
    1. Johnson JE, Nasar F, Coleman JW, Price RE, Javadian A, Draper K, et al. Neurovirulence properties of recombinant vesicular stomatitis virus vectors in non-human primates. Virology. 2007;360:36–49. - PMC - PubMed
    1. Levenbook I, Draper K. Neuropathogenesis and neurovirulence of live flaviviral vaccines in monkeys. J Virol. 2009;83:5289–90. - PMC - PubMed

Publication types

MeSH terms