Comparative Study
. 2010 Nov 2;101(4):518-26.
doi: 10.1016/j.physbeh.2010.07.019. Epub 2010 Aug 3.

Role of caloric homeostasis and reward in alcohol intake in Syrian golden hamsters

Affiliations
Comparative Study

Role of caloric homeostasis and reward in alcohol intake in Syrian golden hamsters

Danielle Gulick et al. Physiol Behav. .

Abstract

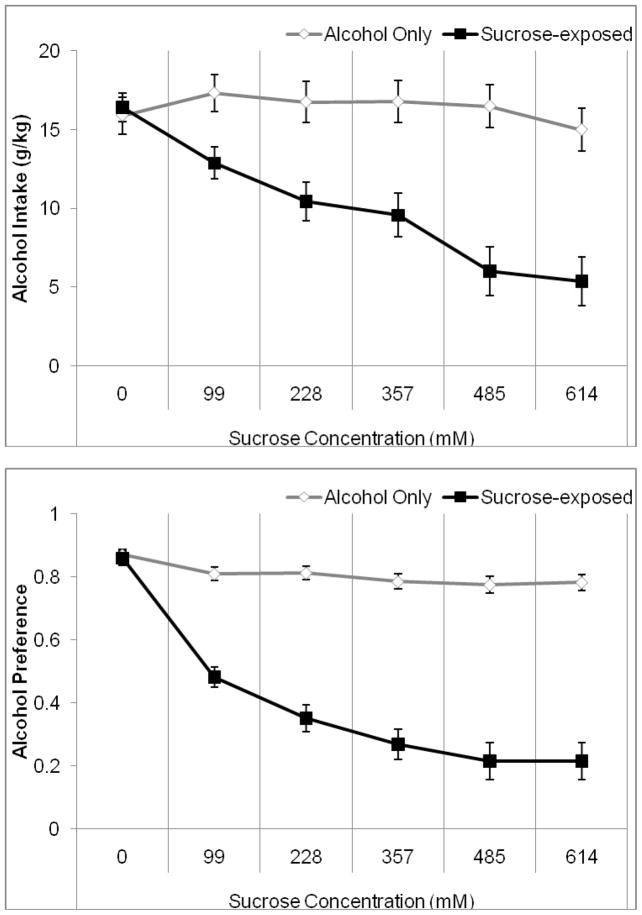
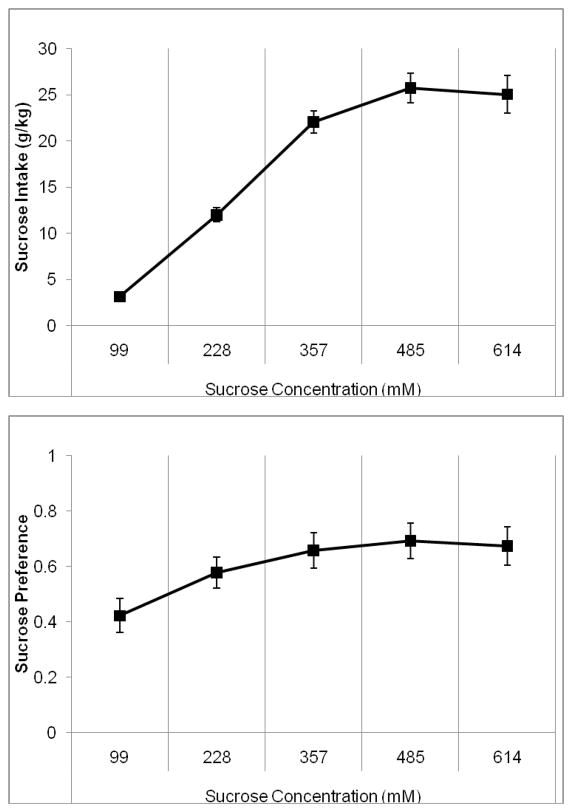
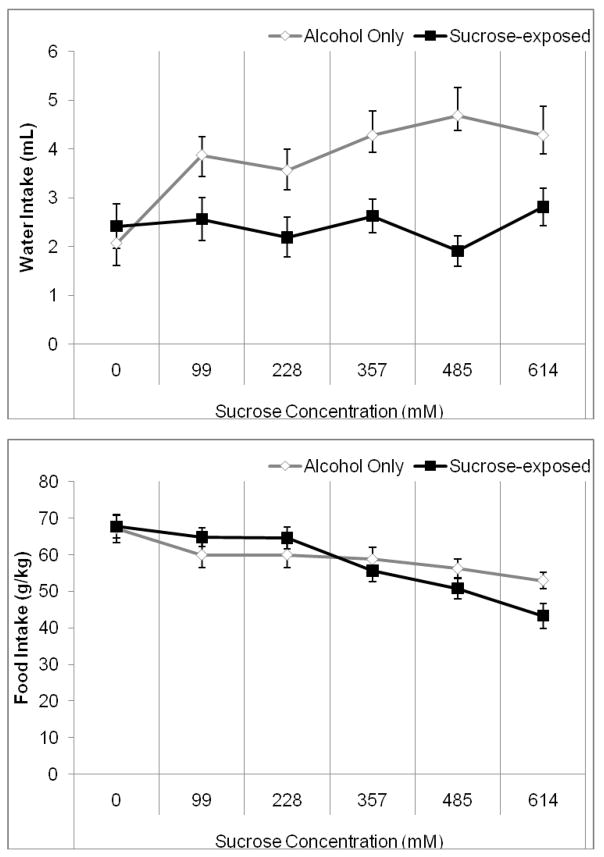
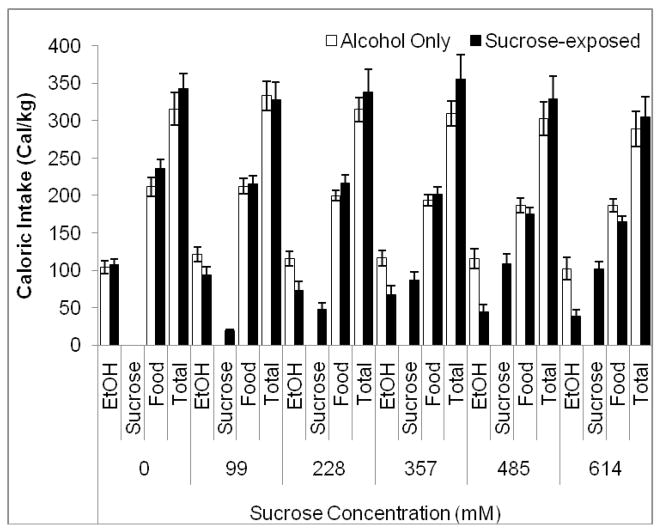
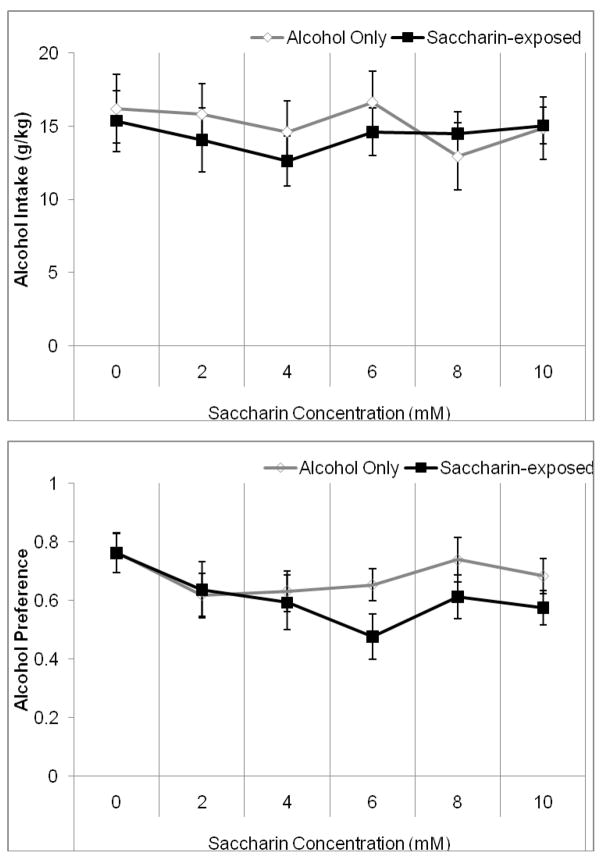
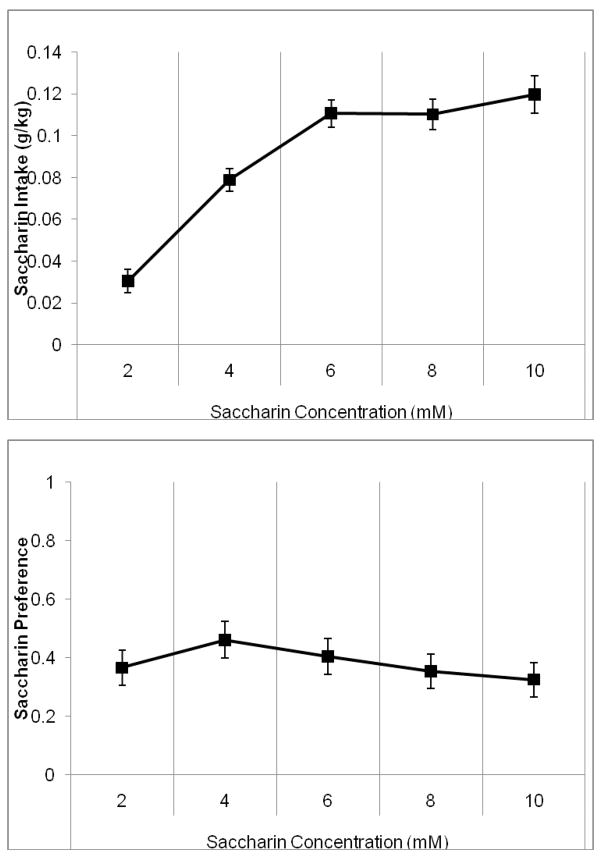
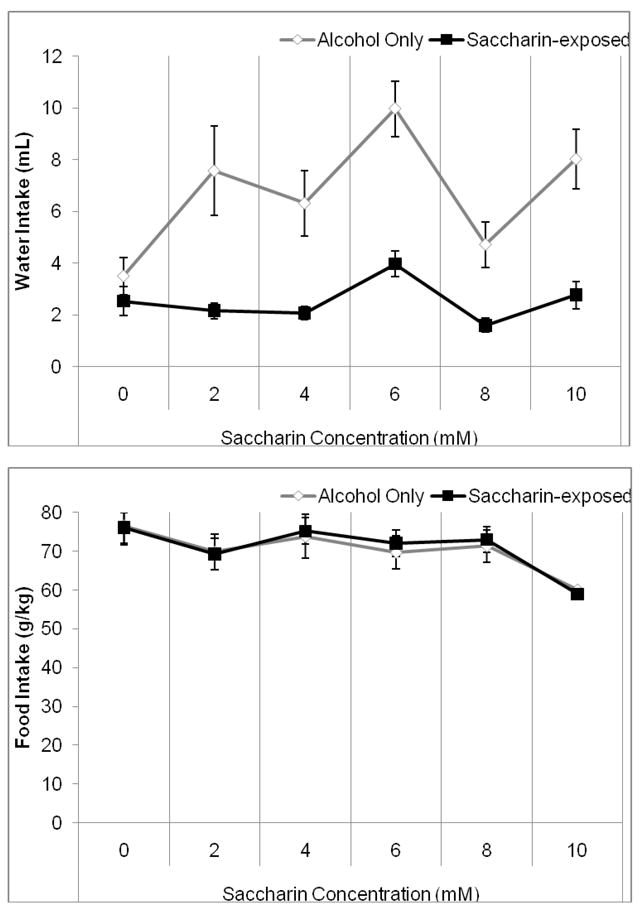
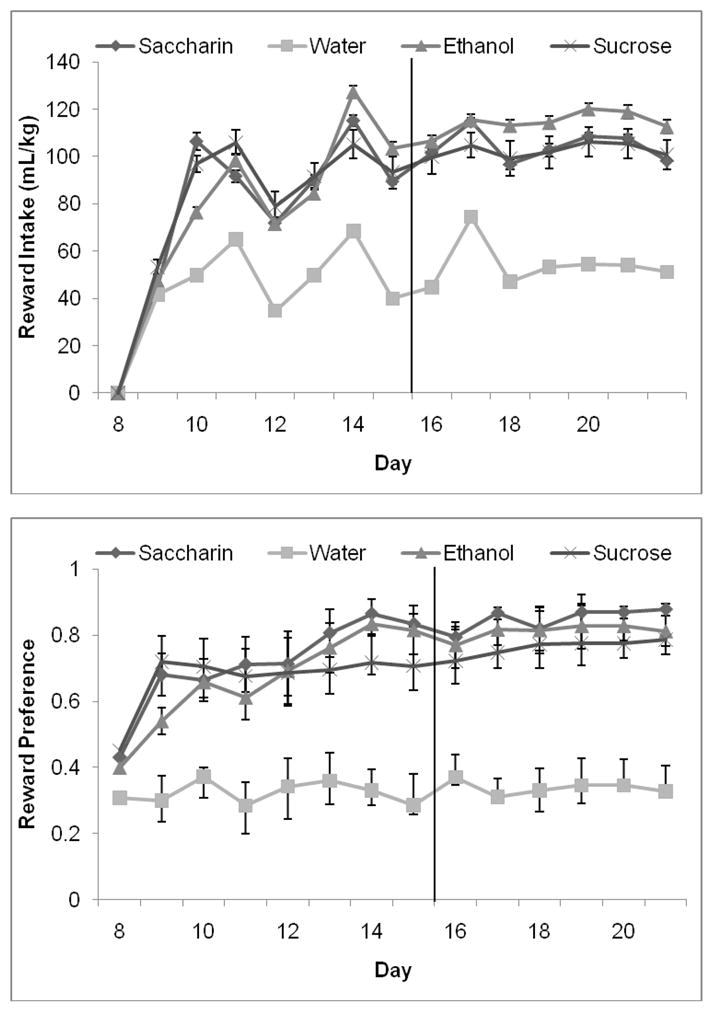
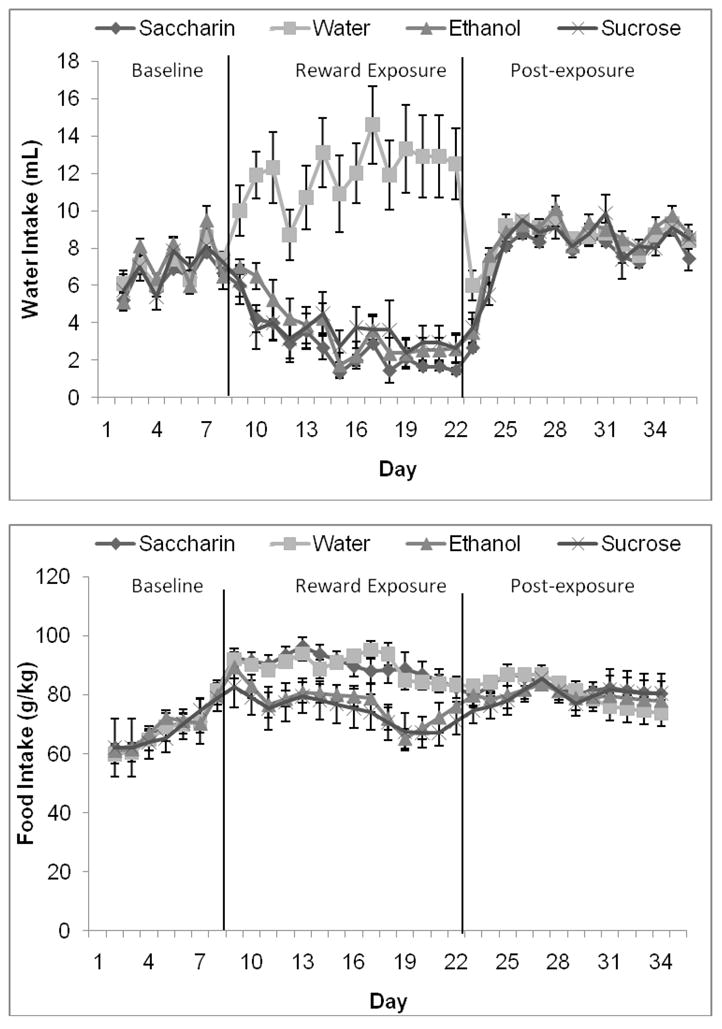
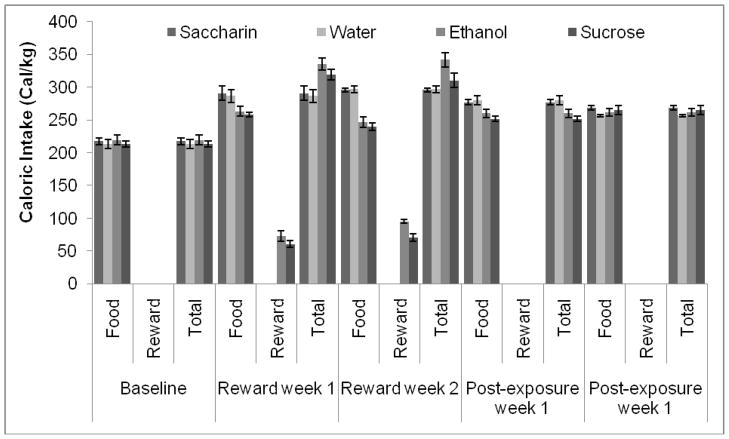
The Syrian golden hamster drinks alcohol readily, but only achieves moderate blood alcohol levels, and does not go through withdrawal from alcohol. Because the hamster is a model of caloric homeostasis, both caloric content and reward value may contribute to the hamster's alcohol consumption. The current study examines alcohol consumption in the hamster when a caloric or non-caloric sweet solution is concurrently available and caloric intake in the hamster before, during, and after exposure to either: alcohol, sucrose or saccharin. In Experiments 1 and 2, hamsters were given access to alcohol (15% v/v) and water; once alcohol consumption steadied, a bottle containing an ascending concentration of sucrose (99-614 mM) or saccharin (2-10 mM), or water was added. In Experiment 3, hamsters were given access to alcohol (15% v/v), sucrose (614 mM), saccharin (4 mM), or a second water bottle for 14 days. After the second bottle was removed, measurements continued for 14days. Sucrose exposure suppressed alcohol consumption at concentrations lower in calories than the alcohol solution. Saccharin exposure failed to suppress alcohol consumption. Exposure to sucrose and alcohol but not saccharin decreased food intake. Decreased alcohol consumption in response to a caloric sweetener and decreased food intake during alcohol exposure support that alcohol consumption by the hamster is mediated by caloric content. However, suppression of alcohol intake by a sucrose solution of lower caloric content and the equivalent intake of individual alcohol, sucrose and saccharin solutions support a role for reward value in alcohol consumption.


Figures

Figure 1
Figure 1
Average alcohol intake and preference during the last four days of exposure to each sucrose concentration. A) Alcohol intake decreased when sucrose was made available. Concentrations of 485–614 mM sucrose produced maximal suppression of alcohol intake. B) Alcohol preference decreased when sucrose was made available. Concentrations of 357–614 mM sucrose produced maximal suppression of alcohol preference (Mean ± SEM).
Figure 2
Figure 2
Average sucrose intake and preference during the last four days at each concentration when presented with alcohol. A) Sucrose intake increased significantly between each of the first four sucrose concentrations (99–485 mM) but not between the fourth and fifth concentrations. B) Sucrose preference increased between the first and second sucrose concentrations (99–228 mM), then remained stable for the remainder of sucrose exposure (Mean ± SEM).
Figure 3
Figure 3
Water and food intake during exposure to alcohol and sucrose. A) The alcohol control group consumed more water during the latter three concentrations of exposure to sucrose (357–614 mM). B) The group exposed to sucrose ate significantly less during the final two sucrose concentrations (485–614 mM) than it did prior to sucrose exposure, and also ate less than the alcohol control group during the final sucrose concentration (614 mM) (Mean ± SEM).
Figure 4
Figure 4
Total caloric intake during exposure to alcohol and sucrose. The group exposed to sucrose consumed more calories than the alcohol control group only during the third sucrose concentration (357 mM). Additionally, caloric intake in both groups increased between the second and third sucrose concentrations (228–357 mM) and then decreased steadily until the final sucrose concentration (614 mM) (Mean ± SEM).
Figure 5
Figure 5
Average alcohol intake and preference during the last four days of exposure to each saccharin concentration. A) There were no significant changes in alcohol intake. B) Alcohol preference decreased in the first saccharin concentration (2 mM) and increased in the fourth saccharin concentration (8 mM), but there were no differences between groups (Mean ± SEM).
Figure 6
Figure 6
Average saccharin intake and preference during the last four days at each concentration when presented with alcohol. A) Saccharin intake increased significantly between each of the first three sucrose concentrations (2–6 mM) but there were no other differences. B) Saccharin preference increased between the first and second saccharin concentrations (2–4 mM), then decreased between each of the next three saccharin concentrations (4–8 mM) (Mean ± SEM).
Figure 7
Figure 7
Water and food intake during exposure to alcohol and saccharin. A) The saccharin-exposed group drank significantly less water than the alcohol control group throughout exposure to saccharin. B) Food intake decreased between the alcohol baseline period and the first saccharin concentration (2 mM) and again between the third and fifth saccharin concentrations (6–10 mM) but there were no differences between groups (Mean ± SEM).
Figure 8
Figure 8
Reward intake and preference. A) There was greater consumption of alcohol, saccharin, and sucrose than water in the second week of exposure to the rewards, but there were no differences in intake of the three rewarding solutions. B) There was greater preference for alcohol, saccharin, and sucrose than water during both weeks of exposure to the rewards, but there were no differences in preference for the three rewarding solutions (Mean ± SEM).
Figure 9
Figure 9
Water and food intake before, during, and after exposure to alcohol, sucrose, and saccharin. A) Water intake decreased in all three groups exposed to rewarding solutions during both weeks of exposure to the rewards, and increased in the group exposed only to water during the same period. B) Food intake was greater in all groups during the two weeks of exposure to the rewards than during the week of baseline measurements. In addition, the group exposed to sucrose ate less than the water- and saccharin-exposed groups during both weeks of exposure to the rewards, and the group exposed to alcohol ate less than the water- and saccharin-exposed groups during the second week of exposure to the rewards (Mean ± SEM).
Figure 10
Figure 10
Total caloric intake before, during, and after exposure to alcohol, sucrose, and saccharin. The alcohol- and sucrose-exposed groups consumed more calories during the first week of exposure to the rewards than the saccharin-exposed and water only groups; the sucrose-exposed group returned to a baseline level of caloric intake by the second week of exposure to the rewards, but the alcohol-exposed group remained elevated compared to the other groups (Mean ± SEM).

Similar articles

Cited by

References

    1. Chau DT, Gulick D, Xie H, Dawson R, Green AI. Clozapine chronically suppresses alcohol drinking in Syrian golden hamsters. Neuropharmacology. 2009 - PMC - PubMed
    1. DiBattista D. Voluntary ethanol consumption and obesity in golden hamsters. Physiology & behavior. 1986;36:41–5. - PubMed
    1. Green AI, Chau DT, Keung WM, Dawson R, Mesholam RI, Schildkraut JJ. Clozapine reduces alcohol drinking in Syrian golden hamsters. Psychiatry Res. 2004;128:9–20. - PubMed
    1. DiBattista D, McKenzie TL, Hollis-Walker L. Cholecystokinin reduces ethanol consumption in golden hamsters. Alcohol. 2003;29:173–81. - PubMed
    1. Piercy KT, Myers RD. Tomato juice, chocolate drink, and other fluids suppress volitional drinking of alcohol in the female Syrian golden hamster. Physiol Behav. 1995;57:1155–61. - PubMed

Publication types