

Assessment of advanced coronary artery disease: advantages of quantitative cardiac magnetic resonance perfusion analysis
- PMID: 20688211
- PMCID: PMC2930835
- DOI: 10.1016/j.jacc.2010.02.061
Assessment of advanced coronary artery disease: advantages of quantitative cardiac magnetic resonance perfusion analysis
Abstract
Objectives: The purpose of this paper was to compare quantitative cardiac magnetic resonance (CMR) first-pass contrast-enhanced perfusion imaging to qualitative interpretation for determining the presence and severity of coronary artery disease (CAD).
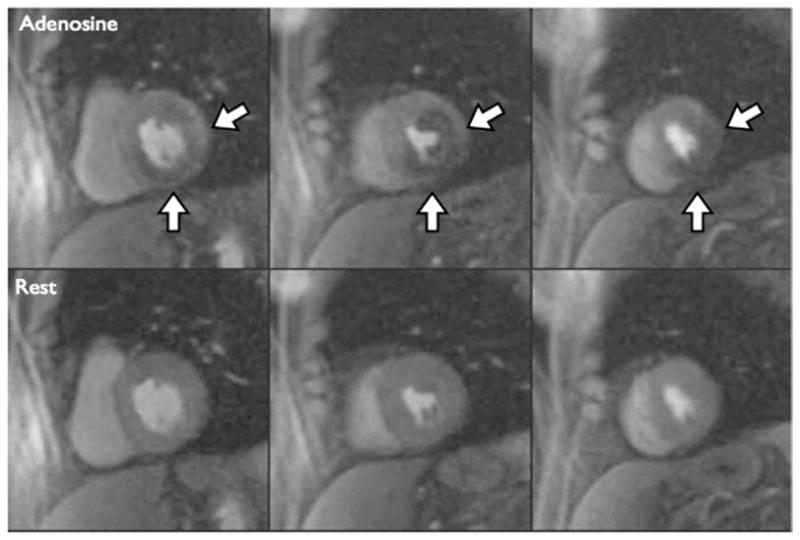
Background: Adenosine CMR can detect CAD by measuring perfusion reserve (PR) or by qualitative interpretation (QI).
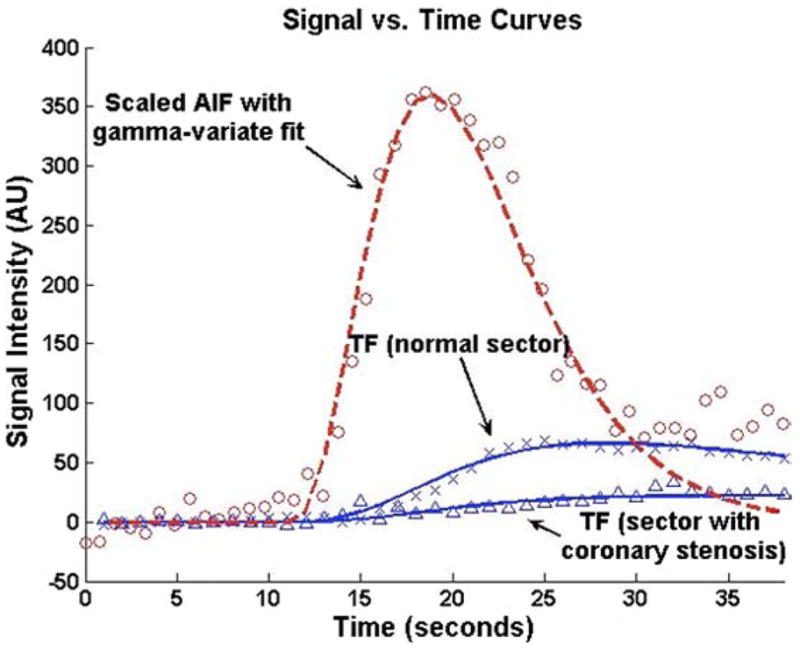
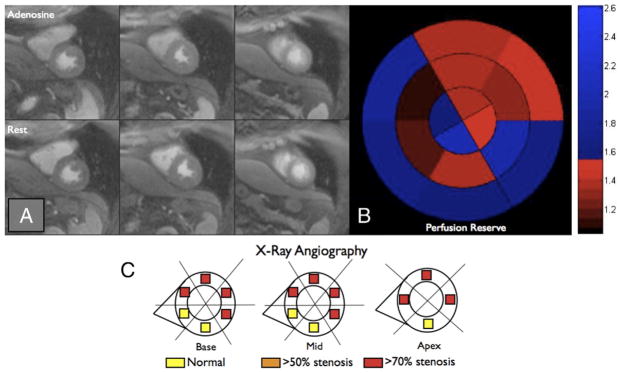
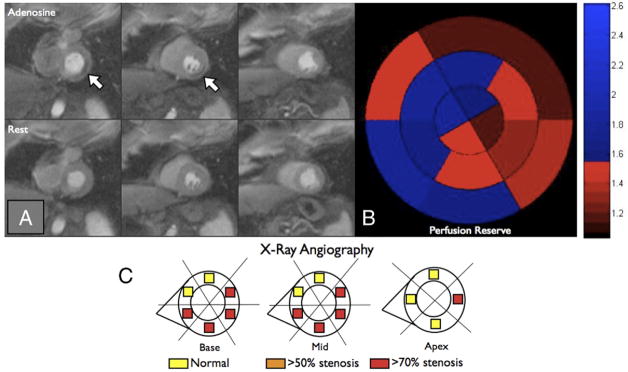
Methods: Forty-one patients with an abnormal nuclear stress scheduled for X-ray angiography underwent dual-bolus adenosine CMR. Segmental myocardial perfusion analyzed using both QI and PR by Fermi function deconvolution was compared to quantitative coronary angiography.
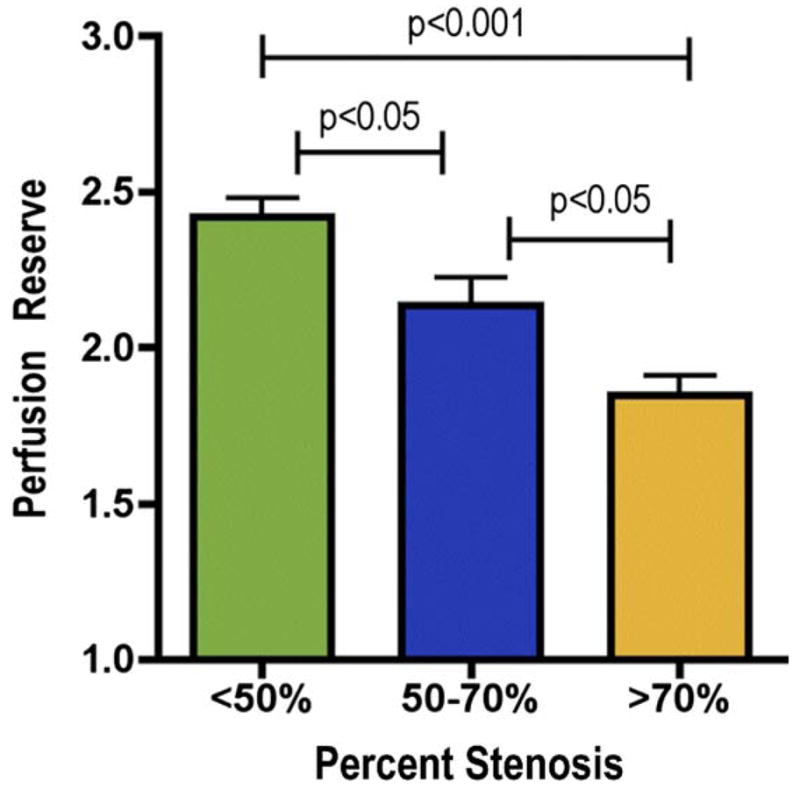
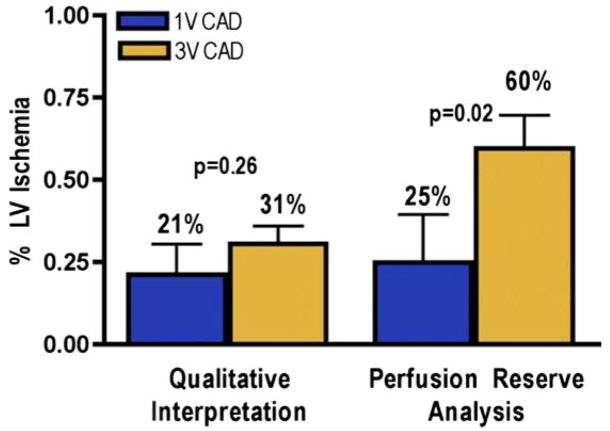
Results: In the 30 patients with complete quantitative data, PR (mean +/- SD) decreased stepwise as coronary artery stenosis (CAS) severity increased: 2.42 +/- 0.94 for <50%, 2.14 +/- 0.87 for 50% to 70%, and 1.85 +/- 0.77 for >70% (p < 0.001). The PR and QI had similar diagnostic accuracies for detection of CAS >50% (83% vs. 80%), and CAS >70% (77% vs. 67%). Agreement between observers was higher for quantitative analysis than for qualitative analysis. Using PR, patients with triple-vessel CAD had a higher burden of detectable ischemia than patients with single-vessel CAD (60% vs. 25%; p = 0.02), whereas no difference was detected by QI (31% vs. 21%; p = 0.26). In segments with myocardial scar (n = 64), PR was 3.10 +/- 1.34 for patients with CAS <50% (n = 18) and 1.91 +/- 0.96 for CAS >50% (p < 0.0001).
Conclusions: Quantitative PR by CMR differentiates moderate from severe stenoses in patients with known or suspected CAD. The PR analysis differentiates triple- from single-vessel CAD, whereas QI does not, and determines the severity of CAS subtending myocardial scar. This has important implications for assessment of prognosis and therapeutic decision making.
Copyright (c) 2010 American College of Cardiology Foundation. Published by Elsevier Inc. All rights reserved.
Figures
References
-
- Nandalur KR, Dwamena BA, Choudhri AF, Nandalur MR, Carlos RC. Diagnostic performance of stress cardiac magnetic resonance imaging in the detection of coronary artery disease: a meta-analysis. J Am Coll Cardiol. 2007;50:1343–53. - PubMed
-
- Schwitter J, Wacker CM, van Rossum AC, et al. MR-IMPACT: comparison of perfusion-cardiac magnetic resonance with single-photon emission computed tomography for the detection of coronary artery disease in a multicentre, multivendor, randomized trial. Eur Heart J. 2008;29:480–9. - PubMed
-
- Klem I, Heitner JF, Shah DJ, et al. Improved detection of coronary artery disease by stress perfusion cardiovascular magnetic resonance with the use of delayed enhancement infarction imaging. J Am Coll Cardiol. 2006;47:1630–8. - PubMed
-
- Jahnke C, Nagel E, Gebker R, et al. Prognostic value of cardiac magnetic resonance stress tests: adenosine stress perfusion and dobut-amine stress wall motion imaging. Circulation. 2007;115:1769–76. - PubMed
-
- Rieber J, Huber A, Erhard I, et al. Cardiac magnetic resonance perfusion imaging for the functional assessment of coronary artery disease: a comparison with coronary angiography and fractional flow reserve. Eur Heart J. 2006;27:1465–71. - PubMed
Publication types
MeSH terms
Substances
Grants and funding
LinkOut - more resources
Full Text Sources
Medical
Research Materials
Miscellaneous
