

Carbon nanotubes-based chemiresistive immunosensor for small molecules: detection of nitroaromatic explosives
- PMID: 20688506
- PMCID: PMC3108850
- DOI: 10.1016/j.bios.2010.07.017
Carbon nanotubes-based chemiresistive immunosensor for small molecules: detection of nitroaromatic explosives
Abstract
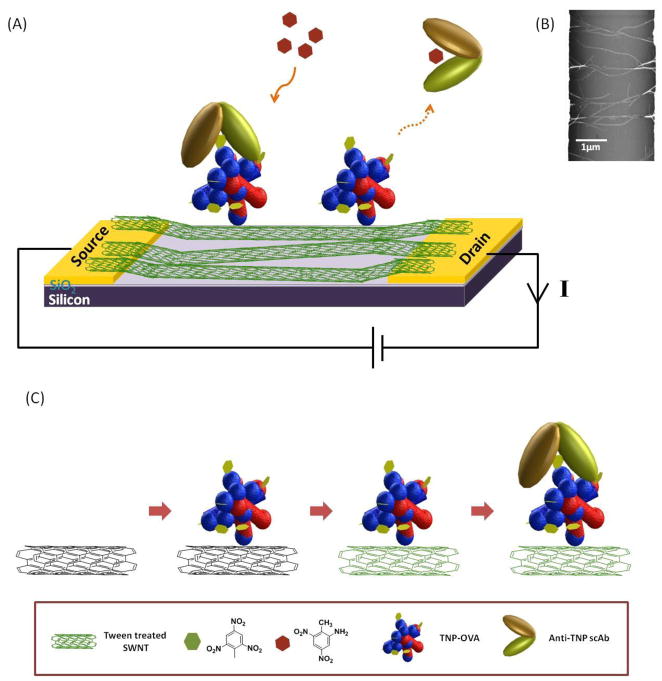
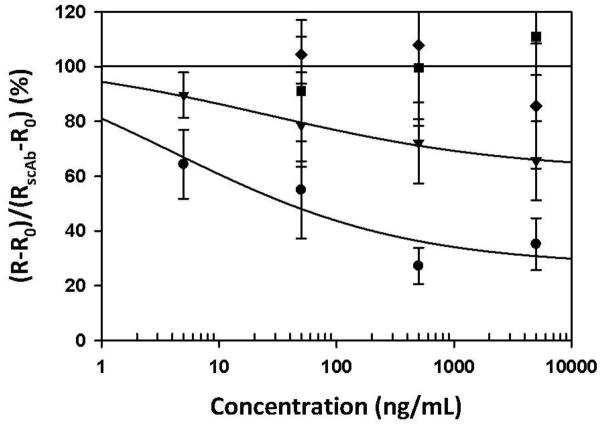
In recent years, there has been a growing focus on use of one-dimensional (1-D) nanostructures, such as carbon nanotubes and nanowires, as transducer elements for label-free chemiresistive/field-effect transistor biosensors as they provide label-free and high sensitivity detection. While research to-date has elucidated the power of carbon nanotubes- and other 1-D nanostructure-based field effect transistors immunosensors for large charged macromolecules such as proteins and viruses, their application to small uncharged or charged molecules has not been demonstrated. In this paper we report a single-walled carbon nanotubes (SWNTs)-based chemiresistive immunosensor for label-free, rapid, sensitive and selective detection of 2,4,6-trinitrotoluene (TNT), a small molecule. The newly developed immunosensor employed a displacement mode/format in which SWNTs network forming conduction channel of the sensor was first modified with trinitrophenyl (TNP), an analog of TNT, and then ligated with the anti-TNP single chain antibody. Upon exposure to TNT or its derivatives the bound antibodies were displaced producing a large change, several folds higher than the noise, in the resistance/conductance of SWNTs giving excellent limit of detection, sensitivity and selectivity. The sensor detected between 0.5 ppb and 5000 ppb TNT with good selectivity to other nitroaromatic explosives and demonstrated good accuracy for monitoring TNT in untreated environmental water matrix. We believe this new displacement format can be easily generalized to other one-dimensional nanostructure-based chemiresistive immuno/affinity-sensors for detecting small and/or uncharged molecules of interest in environmental monitoring and health care.
Copyright © 2010 Elsevier B.V. All rights reserved.
Figures


Similar articles
-
Surface plasmon resonance immunosensor for highly sensitive detection of 2,4,6-trinitrotoluene.Biosens Bioelectron. 2005 Mar 15;20(9):1750-6. doi: 10.1016/j.bios.2004.06.044. Biosens Bioelectron. 2005. PMID: 15681190
-
Near infrared optical biosensor based on peptide functionalized single-walled carbon nanotubes hybrids for 2,4,6-trinitrotoluene (TNT) explosive detection.Anal Biochem. 2018 Jun 1;550:49-53. doi: 10.1016/j.ab.2018.04.011. Epub 2018 Apr 12. Anal Biochem. 2018. PMID: 29655769
-
Multi-channeled single chain variable fragment (scFv) based microfluidic device for explosives detection.Talanta. 2015 Nov 1;144:439-44. doi: 10.1016/j.talanta.2015.06.039. Epub 2015 Jun 20. Talanta. 2015. PMID: 26452845
-
Carbon nanotubes-based label-free affinity sensors for environmental monitoring.Appl Biochem Biotechnol. 2013 Jul;170(5):1011-25. doi: 10.1007/s12010-013-0233-z. Epub 2013 May 8. Appl Biochem Biotechnol. 2013. PMID: 23653139 Review.
-
Carbon nanomaterial-based electrochemical biosensors for label-free sensing of environmental pollutants.Chemosphere. 2016 Jan;143:85-98. doi: 10.1016/j.chemosphere.2015.04.063. Epub 2015 May 5. Chemosphere. 2016. PMID: 25956023 Review.
Cited by
-
Antibodies and antibody-derived analytical biosensors.Essays Biochem. 2016 Jun 30;60(1):9-18. doi: 10.1042/EBC20150002. Essays Biochem. 2016. PMID: 27365031 Free PMC article. Review.
-
A Novel Bioelectronic Reporter System in Living Cells Tested with a Synthetic Biological Comparator.Sci Rep. 2019 May 13;9(1):7275. doi: 10.1038/s41598-019-43771-w. Sci Rep. 2019. PMID: 31086248 Free PMC article.
-
Nanoengineering Approaches Toward Artificial Nose.Front Chem. 2021 Feb 18;9:629329. doi: 10.3389/fchem.2021.629329. eCollection 2021. Front Chem. 2021. PMID: 33681147 Free PMC article. Review.
-
Predicting Future Prospects of Aptamers in Field-Effect Transistor Biosensors.Molecules. 2020 Feb 5;25(3):680. doi: 10.3390/molecules25030680. Molecules. 2020. PMID: 32033448 Free PMC article.
-
MEISENHEIMER COMPLEX BETWEEN 2,4,6-TRINITROTOLUENE AND 3-AMINOPROPYLTRIETHOXYSILANE AND ITS USE FOR A PAPER-BASED SENSOR.Sens Biosensing Res. 2015 Sep 1;5:37-41. doi: 10.1016/j.sbsr.2015.06.003. Sens Biosensing Res. 2015. PMID: 26380171 Free PMC article.
References
-
- Allen BL, Kichambare PD, Star A. Adv Mater. 2007;19:1439–1451.
-
- Azamian BR, Davis JJ, Coleman KS, Bagshaw CB, Green MLH. J Am Chem Soc. 2002;124:12664–12665. - PubMed
-
- Bangar MA, Shirale DJ, Chen W, Myung NV, Mulchandani A. Anal Chem. 2009;81:2168–2175. - PubMed
-
- Elkind JL, Stimpson DI, Strong AA, Bartholomew DU, Melendez JL. Sens Actuators, B. 1999;54:182–190.
-
- Goldman ER, Hayhurst A, Lingerfelt BM, Iverson BL, Georgiou G, Anderson GP. J Environ Monit. 2003;5:380–383. - PubMed
Publication types
MeSH terms
Substances
Grants and funding
LinkOut - more resources
Full Text Sources
