. 2010 Dec;51(12):6504-13.
doi: 10.1167/iovs.10-5551. Epub 2010 Aug 4.

Tracking longitudinal retinal changes in experimental ocular hypertension using the cSLO and spectral domain-OCT

Affiliations

Tracking longitudinal retinal changes in experimental ocular hypertension using the cSLO and spectral domain-OCT

Li Guo et al. Invest Ophthalmol Vis Sci. 2010 Dec.

Abstract

Purpose: Involvement of the outer retina is controversial in glaucoma. The aim of this study was to test, first, whether the outer retina is affected in experimental ocular hypertension (OHT) and, second, whether whole retinal thickness can be used as a surrogate marker of glaucomatous change.

Methods: OHT was surgically induced in 20 Dark Agouti rats. Animals were imaged using a modified Spectralis OCT (Heidelberg Engineering, Heidelberg, Germany) at baseline and at 3 and 8 weeks after OHT induction. Measurements were recorded for whole and individual retinal layer thickness in four regions-temporal, superior, nasal, and inferior-around the optic nerve head.

Results: Whole retinal thickness in normal eyes was 172.19 ± 5.17 μm, with no significant regional differences. OHT caused a significant reduction in whole retinal thickness and the outer nuclear layer (ONL) at 3 and 8 weeks (P < 0.05), along with the expected thinning of the retinal nerve fiber layer (RNFL). Whole retinal thickness correlated well with RNFL (P = 0.035) and ONL (P ≤ 0.001) changes. Sensitivity of RNFL and ONL to IOP exposure appeared greater at 3 than at 8 weeks. In addition, regional profiles were significantly altered in the ONL and RNFL after OHT induction.

Conclusions: Adaptation of the Spectralis OCT enables tracking of structural damage in experimental rat OHT. Here the authors show evidence of glaucomatous damage in the outer retinal layers of this model with significant regional changes and highlight whole retinal thickness in the rat as a useful surrogate marker of inner and outer retinal changes. The authors believe that the OCT data can provide useful information with regard to clinical management.


Figures

Figure 1.
Figure 1.
A customized adaptation of the Spectralis OCT to image rat retina. The normal Spectralis HRA (Heidelberg Engineering) objective with the +10 D lens adapter mounted to the lens (A), and the Spectralis HRA with the 100-mm focal length lens mounted in front of the HRA ophthalmic lens (B). A screen image shows that the modified Spectralis OCT can acquire simultaneous high-quality SLO and OCT images of the living rat retina (C).
Figure 2.
Figure 2.
Measurements of thickness of the whole retina and individual layers from Spectralis OCT cross-sections. Representative 3D OCT volume automatic reconstruction (A), reflectance retinal image (B), and grid scale with precalibrated regions (C) illustrating the four locations (T, S, N, and I) used in measurements of rat left eyes. The area of each preset location is 100 × 100 pixels or 364 μm × 350 μm. OCT cross-section images obtained from averaging 25 B-scans (D, E) from a single preset location processed and analyzed to enable measurements of the whole retinal and individual layer thickness, after manual segmentation of each layer, outlined in red (E). RNFL/RGCL, retinal nerve fiber layer/retinal ganglion cell layer; IPL, inner plexiform layer; INL, inner nuclear layer; OPL, outer plexiform layer; ONL, outer nuclear layer.
Figure 3.
Figure 3.
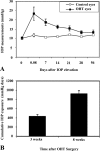
IOP profiles in OHT and control rat eyes. (A) Mean baseline IOP before surgery was 10.29 ± 0.59 mm Hg. Surgery induced an increase of IOP, with a mean peak IOP of 23.43 ± 3.50 mm Hg at 2 hours (0.08 day) after surgery. The IOP gradually decreased to near baseline level at 56 days (8 weeks). (B) Cumulative IOP exposure was calculated as an integral IOP at 3 (429.79 ± 37.11 mm Hg days) and 8 (918.92 ± 65.76 mm Hg days) weeks after OHT induction.
Figure 4.
Figure 4.
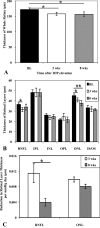
Regional thickness of the whole retina and individual layers in the normal rat. Thickness is calculated by the mean value of 40 rat eyes. RNFL, retinal nerve fiber layer; IPL, inner plexiform layer; INL, inner nuclear layer; OPL, outer plexiform layer; ONL, outer nuclear layer.
Figure 5.
Figure 5.
OHT-induced changes in the overall thickness of the whole retina and individual retinal layers. Increased IOP caused significant reduction in whole retinal thickness at 3 and 8 weeks (A; P < 0.05). Analysis of individual layers revealed that the RNFL was significantly thinner at 3 weeks than at baseline (B; P < 0.05) and that the ONL was significantly thinner at both 3 (P < 0.05) and 8 (P < 0.01) weeks after IOP elevation (B). IOP exposure caused more damage in the retinal layers at the earlier (3 weeks) than at the later (8 weeks) time points, with a statistically significant greater reduction in RNFL thickness per mm Hg day at 3 weeks than at 8 weeks (C; P = 0.049). *P < 0.05; **P < 0.01.
Figure 6.
Figure 6.
In vivo Spectralis OCT cross-sectional serial images showing OHT-induced changes at the four regions of the retina at baseline (BL) and at 3 and 8 weeks after IOP elevation, in the left eye of the same rat.
Figure 7.
Figure 7.
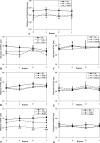
OHT-induced changes in regional thickness in the whole retina and in individual layers. Regional thickness of the whole retina (A), RNFL (B), IPL (C), INL (D), OPL (E), ONL (F), and IS/OS of photoreceptors (G) at baseline (BL) and at 3 and 8 weeks after IOP elevation. The whole retina showed significant thinning in the regions of S and I at 3 weeks (P < 0.05) and of T, N, and I at 8 weeks (P < 0.05; A). For individual layers, the RNFL was significantly thinner in the S region at 3 weeks (P < 0.05; B). The ONL showed significant thinning in region I at 3 weeks (P < 0.05) and in all regions (T, S, N, and I) at 8 weeks (P < 0.05 to P < 0.01; F). There were no significant changes in other retinal layers (C, D, E, G). *P < 0.05; **P < 0.01.

Similar articles

Cited by

References

    1. Harwerth RS, Carter-Dawson L, Shen F, Smith EL, 3rd, Crawford ML. Ganglion cell losses underlying visual field defects from experimental glaucoma. Invest Ophthalmol Vis Sci. 1999;40:2242–2250 - PubMed
    1. Sommer A, Miller NR, Pollack I, Maumenee AE, George T. The nerve fiber layer in the diagnosis of glaucoma. Arch Ophthalmol. 1977;95:2149–2156 - PubMed
    1. Huang D, Swanson EA, Lin CP, et al. Optical coherence tomography. Science. 1991;254:1178–1181 - PMC - PubMed
    1. van Velthoven ME, Verbraak FD, Yannuzzi LA, Rosen RB, Podoleanu AG, de Smet MD. Imaging the retina by en face optical coherence tomography. Retina. 2006;26:129–136 - PubMed
    1. Drexler W, Fujimoto JG. State-of-the-art retinal optical coherence tomography. Prog Retin Eye Res. 2008;27:45–88 - PubMed

Publication types