. 2010 Sep;20(9):1180-90.
doi: 10.1101/gr.104976.110. Epub 2010 Aug 5.

Susceptibility to chronic pain following nerve injury is genetically affected by CACNG2

Affiliations

Susceptibility to chronic pain following nerve injury is genetically affected by CACNG2

Jonathan Nissenbaum et al. Genome Res. 2010 Sep.

Abstract

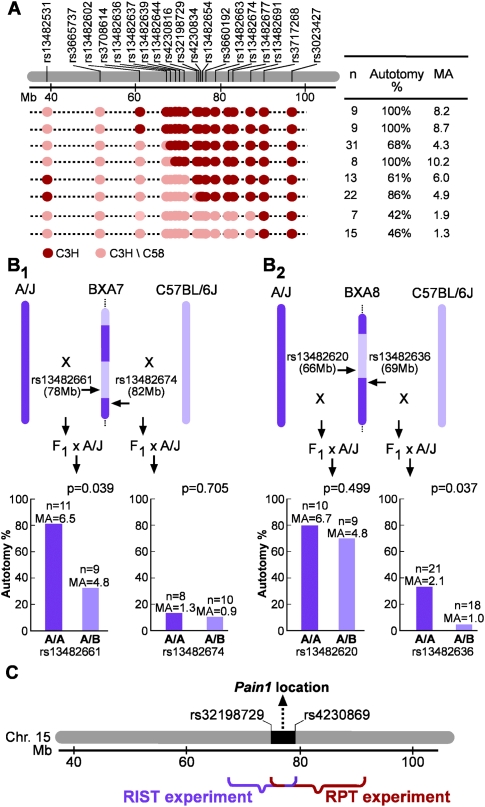
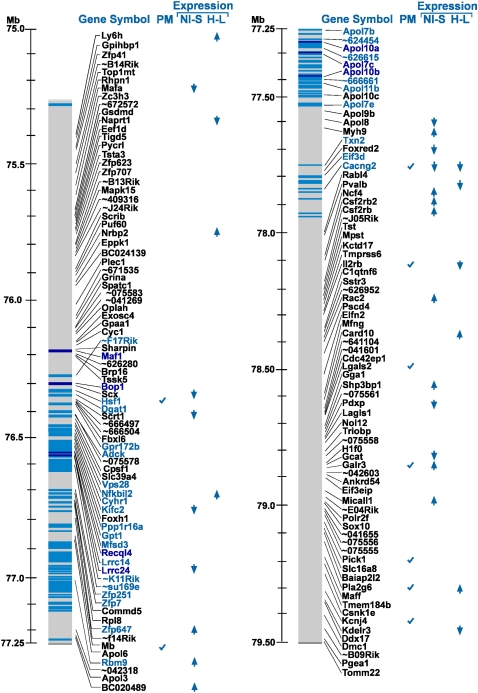
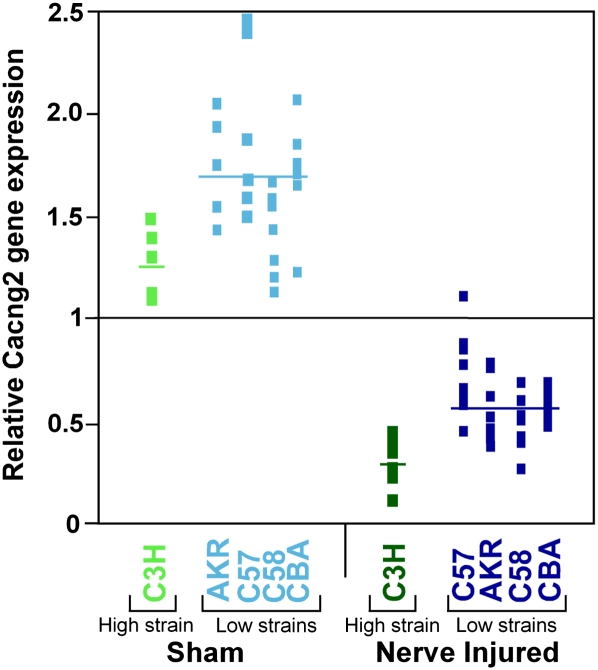
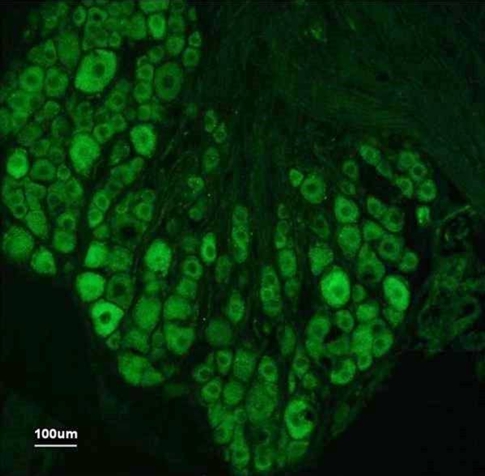
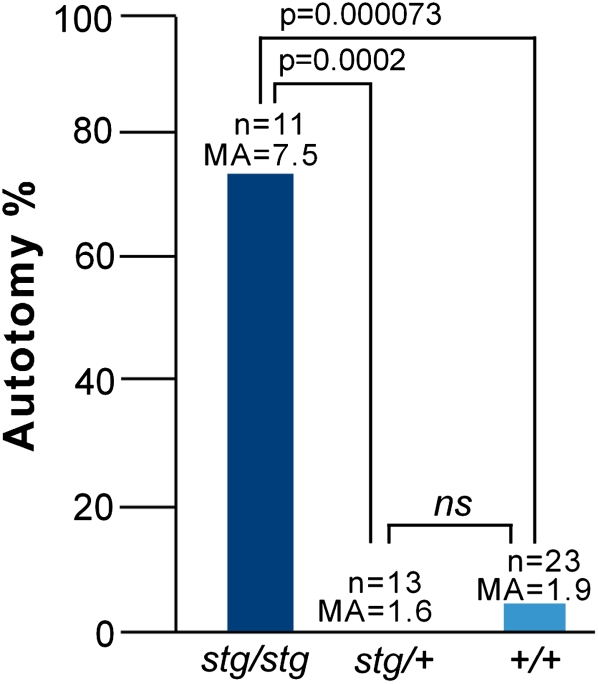
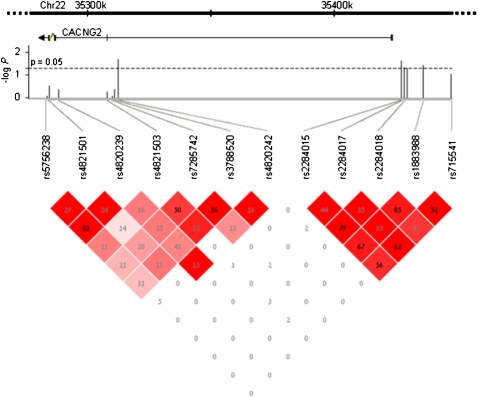
Chronic neuropathic pain is affected by specifics of the precipitating neural pathology, psychosocial factors, and by genetic predisposition. Little is known about the identity of predisposing genes. Using an integrative approach, we discovered that CACNG2 significantly affects susceptibility to chronic pain following nerve injury. CACNG2 encodes for stargazin, a protein intimately involved in the trafficking of glutamatergic AMPA receptors. The protein might also be a Ca(2+) channel subunit. CACNG2 has previously been implicated in epilepsy. Initially, using two fine-mapping strategies in a mouse model (recombinant progeny testing [RPT] and recombinant inbred segregation test [RIST]), we mapped a pain-related quantitative trait locus (QTL) (Pain1) into a 4.2-Mb interval on chromosome 15. This interval includes 155 genes. Subsequently, bioinformatics and whole-genome microarray expression analysis were used to narrow the list of candidates and ultimately to pinpoint Cacng2 as a likely candidate. Analysis of stargazer mice, a Cacng2 hypomorphic mutant, provided electrophysiological and behavioral evidence for the gene's functional role in pain processing. Finally, we showed that human CACNG2 polymorphisms are associated with chronic pain in a cohort of cancer patients who underwent breast surgery. Our findings provide novel information on the genetic basis of neuropathic pain and new insights into pain physiology that may ultimately enable better treatments.


Figures

Figure 1.
Figure 1.
Fine mapping of Pain1 using RPT and RIST. (A) The RPT experiment. The region of chromosome 15 containing Pain1 and the genotype of 17 SNPs for the eight recombinant progenitor males (and two additional SNPs for progenitor #6) are shown. Here, and in B, “Autotomy %” is the percentage of animals with an autotomy score >1; n = the number of female mice phenotyped, and MA is the mean autotomy score. (B) The RIST experiment. For each of the four BC populations—(B1) two BXA7 BCs; (B2) two BXA8 BCs—a comparison of A/A (homozygous A/J) versus A/B (heterozygous A/J-C57BL/6J) at the relevant SNP is shown. (C) RIST and RPT map integration.
Figure 2.
Figure 2.
Integrative analysis of the 155 genes within the Pain1-containing interval. The gene names and their location on mouse chromosome 15 are shown on the left gray bar. (Blue bars) SNPs with a complete cosegregation among the seven mouse strains (see text); (dark blue bars) coding nonsynonymous SNPs; (light blue) other SNPs. Predicted/annotated genes and hypothetical protein names (long names) are given as “∼xxxxxx” (where xxxxxx is the six last characters of the gene name). For the full name, see Supplemental Table S3. The column “PM” indicates genes found to be related to pain physiology in a PubMed search. The columns “NI-S” (NI, nerve-injured; S, sham) and “H-L” (H, high autotomy; L, low autotomy) highlight genes with significant expression-fold change (the direction of the arrowheads indicates up-regulation or down-regulation). The “NI-S” column presents the results for the nerve-injured versus sham comparison, and the “H-L” column presents the results for the high-autotomy versus the low-autotomy strains.
Figure 3.
Figure 3.
Cacng2 gene expression. For each mouse, the relative gene expression value at Cacng2 is shown (transcript 1440210_at/#BB342913). This is the expression value in a given mouse divided by the mean expression value across all mice. Results for the high autotomy strain C3H are shown for sham operated mice (light green) and nerve-injured mice (dark green). Results for the low autotomy strains C58, C57, CBA, and AKR are shown for sham-operated mice (light blue) and nerve-injured mice (dark blue). The Cacng2 expression average for each group is represented by a horizontal line. For reference, the horizontal line drawn at 1 represents the mean Cacng2 expression level of all mice.
Figure 4.
Figure 4.
Cacng2 immunofluorescence in the mouse DRG. Fluorescence micrograph from a 12-μm cryosection of a naïve CBA/J mouse L5DRG incubated with antibodies against Stargazin (Cacng2 gene product). Cytoplasmic immunolabeling of varying intensities is seen in neurons of all sizes, but most prominently in neurons of larger sizes.
Figure 5.
Figure 5.
Cacng2 stargazer analysis. Autotomy behavior, comparing alternative stargazer genotypes; stargazer hypomorph (stg/stg), heterozygote (stg/+), and wild-type (+/+). These F2 mice were phenotyped in the presence of a single C3H/HeN mouse, a device that enhances the tendency to autotomize. (Autotomy %) The percentage of animals with an autotomy score ≥ 9. n, the number of mice phenotyped in each group; MA, mean autotomy score; P, statistical significance for the indicated comparisons; ns, not significant.
Figure 6.
Figure 6.
Haplotype analysis of human CACNG2. The 12 SNPs used for genotyping human CACNG2 are listed, along with their map locations relative to the gene on human chromosome 22 (exons and gene orientation are indicated). The statistical significance of allele association with the pain phenotype (in −log P units) is plotted for each SNP. The dashed horizontal line is drawn at P = 0.05 (−log P = 1.3). The bottom part of the figure presents linkage disequilibrium (LD) patterns for the 12 SNPs. In each square, the LD r 2 value of the two SNPs that the square intersects is shown. The intensity of the color represents D′ (the higher D′, the darker the color of the square).

Similar articles

Cited by

References

    1. Bats C, Groc L, Choquet D 2007. The interaction between Stargazin and PSD-95 regulates AMPA receptor surface trafficking. Neuron 53: 719–734 - PubMed
    1. Baugh LR, Hill AA, Brown EL, Hunter CP 2001. Quantitative analysis of mRNA amplification by in vitro transcription. Nucleic Acids Res 29: e29 doi: 10.1093/nar/29.5.e29 - PMC - PubMed
    1. Bjorkman B, Arner S, Hyden LC 2008. Phantom breast and other syndromes after mastectomy: Eight breast cancer patients describe their experiences over time: A 2-year follow-up study. J Pain 9: 1018–1025 - PubMed
    1. Bouhassira D, Lanteri-Minet M, Attal N, Laurent B, Touboul C 2008. Prevalence of chronic pain with neuropathic characteristics in the general population. Pain 136: 380–387 - PubMed
    1. Breivik H, Collett B, Ventafridda V, Cohen R, Gallacher D 2006. Survey of chronic pain in Europe: Prevalence, impact on daily life, and treatment. Eur J Pain 10: 287–333 - PubMed

Publication types

LinkOut - more resources