. 2010 Sep;12(5):653-63.
doi: 10.2353/jmoldx.2010.090101. Epub 2010 Aug 5.

Probabilistic (Bayesian) modeling of gene expression in transplant glomerulopathy

Affiliations

Probabilistic (Bayesian) modeling of gene expression in transplant glomerulopathy

Eric A Elster et al. J Mol Diagn. 2010 Sep.

Abstract

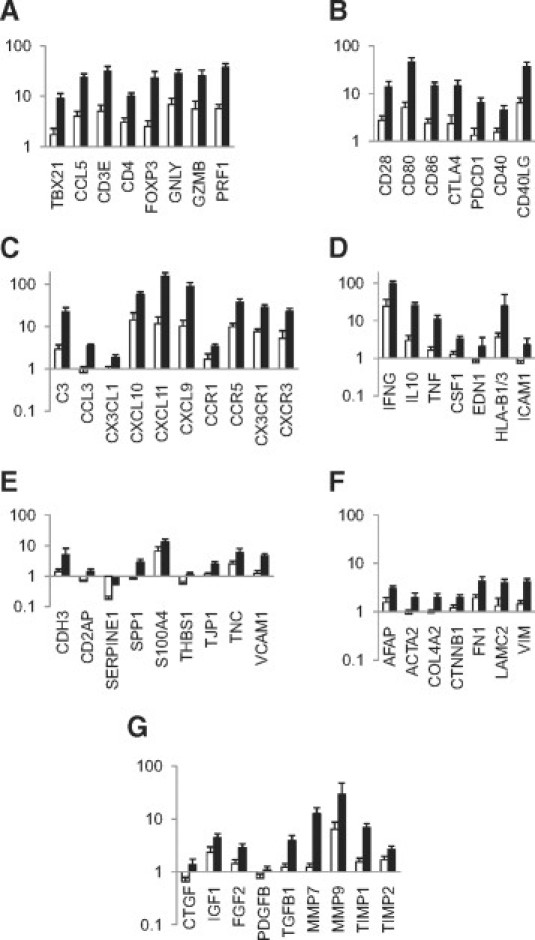
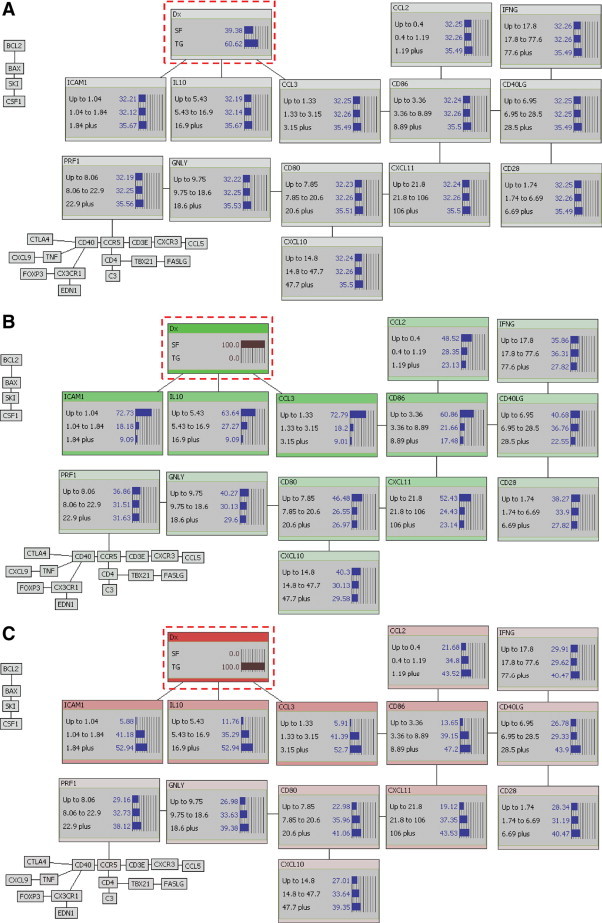
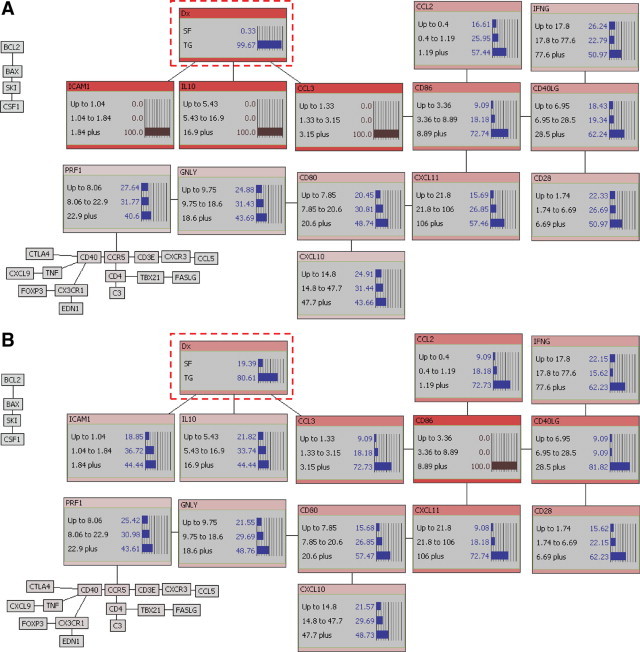
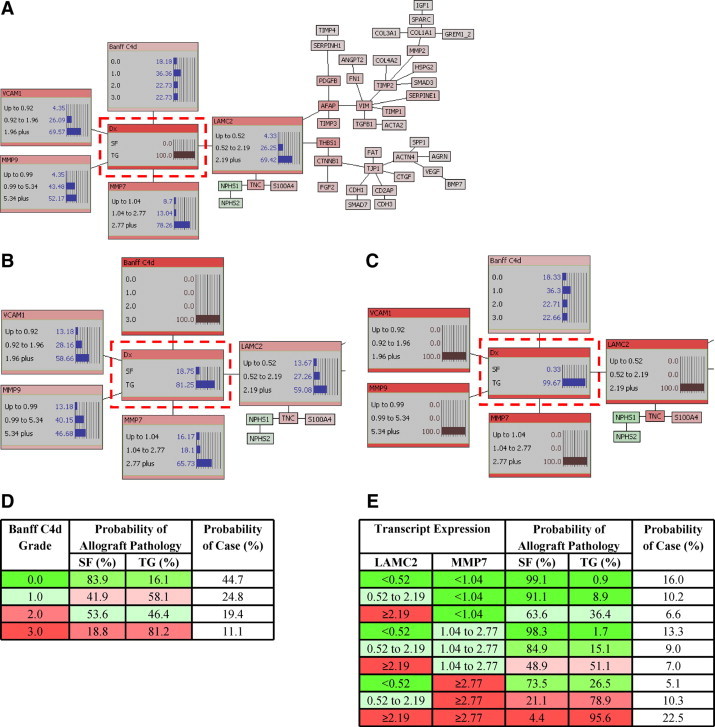
Transplant glomerulopathy (TG) is associated with rapid decline in glomerular filtration rate and poor outcome. We used low-density arrays with a novel probabilistic analysis to characterize relationships between gene transcripts and the development of TG in allograft recipients. Retrospective review identified TG in 10.8% of 963 core biopsies from 166 patients; patients with stable function were studied for comparison. The biopsies were analyzed for expression of 87 genes related to immune function and fibrosis by using real-time PCR, and a Bayesian model was generated and validated to predict histopathology based on gene expression. A total of 57 individual genes were increased in TG compared with stable function biopsies (P < 0.05). The Bayesian analysis identified critical relationships between ICAM-1, IL-10, CCL3, CD86, VCAM-1, MMP-9, MMP-7, and LAMC2 and allograft pathology. Moreover, Bayesian models predicted TG when derived from either immune function (area under the curve [95% confidence interval] of 0.875 [0.675 to 0.999], P = 0.004) or fibrosis (area under the curve [95% confidence interval] of 0.859 [0.754 to 0.963], P < 0.001) gene networks. Critical pathways in the Bayesian models were also analyzed by using the Fisher exact test and had P values <0.005. This study demonstrates that evaluating quantitative gene expression profiles with Bayesian modeling can identify significant transcriptional associations that have the potential to support the diagnostic capability of allograft histology. This integrated approach has broad implications in the field of transplant diagnostics.


Figures

Figure 1
Figure 1
Transcriptional profile comparing stable function and transplant glomerulopathy allografts (GP1 and GP2). Transcript expression levels that were statistically different between SF (open bars) and TG (closed bars) allografts are shown (P < 0.05). TG allografts showed significantly greater expression of transcripts related to T-cell activation and effector function (A), costimulatory molecules (B), chemotaxis (C), inflammatory cytokines and endothelial activation (D), epithelial-mesenchymal transformation (E), cytoskeleton structure (F), and growth factors and regulators of tissue remodeling when compared with SF allografts (G). Results are mean n-fold expression relative to normal, nontransplanted kidneys and depicted on a logarithmic scale. Error bars represent SEM.
Figure 2
Figure 2
Bayesian transcript network (GP1) and relationship to allograft pathology. A: The Bayesian transcript network structure of GP1 as established by the iterative modeling methods. The relative (n-fold) expression is represented for selected transcripts in three equal-area bins with associated probability distributions (blue bar) as predicted by the Bayesian model. In this model, ICAM-1, IL-10, CCL3, and CD86 were critically related to the allograft pathology variable “Dx” (dashed box) as indicated by their adjacent location in the network. Multiple additional cytokine, chemokine, and costimulatory transcripts were also related to allograft pathology but not closely as indicated by their distance from the Dx variable. Transcripts not related to allograft pathology are outside of the network (BCL2, BAX, SKI, and CSF1). B: With a SF allograft (set evidence is indicated by a black bar), the expression of multiple transcripts are decreased within the network, where decreased expression is represented in green and increased expression in red. The degree of shading represents the strength of the transcript relationship to the outcome, where darker is a stronger and lighter a weaker relationship. C: In an allograft with TG (black bar), the expression of the gene transcripts are increased in the Bayesian network.
Figure 3
Figure 3
Bayesian network probability analysis of allograft pathology based on transcript expression. A: With increased expression of ICAM-1 (≥1.84-fold), IL-10 (≥16.9 fold), and CCL3 (≥3.15-fold; black bars), the probability of a TG allograft (dashed box) increases to 99.67%. B: With increased expression (>8.89-fold) of the costimulatory molecule CD86 (black bar), multiple related transcripts are also increased. For example, with increased expression of CD86 the probability of increased expression (>28.5 fold) of CD40L is 81.12%. In addition, the probability of a TG allograft (dashed box) also increased to 80.61%. Black bars indicate set evidence, whereas blue bars indicate probability distributions within each graph.
Figure 4
Figure 4
Bayesian transcript network (GP2) and relationship to allograft pathology. A: In this model, VCAM-1, MMP-9, MMP-7, and LAMC2 are critically related to the allograft pathology (dashed box). In addition, the Banff C4d grade was included in this dataset and is also critically related to allograft pathology. The solid box indicates porting of network shown in B and C. B: With a Banff C4d grade of 3 (black bar), the probability of a TG allograft (dashed box) is 81.25%. C: However, with increased expression of VCAM-1 (≥1.96-fold), MMP-9 (≥5.34-fold), MMP-7 (≥2.77-fold), and LAMC2 (>2.19-fold; black bars), the probability of a TG allograft (dashed box) increases to 99.67%. D: Bayesian prediction of allograft pathology based on C4d deposition. E: Bayesian prediction of allograft pathology based on combinations of LAMC2 and MMP7 expression levels. In panels D and E, “Probability of Case” reflects the occurrence rate of specified combination within the dataset. Low (green) to high (red) values are color coded.

References

    1. Meier-Kriesche HU, Schold JD, Srinivas TR, Kaplan B. Lack of improvement in renal allograft survival despite a marked decrease in acute rejection rates over the most recent era. Am J Transplant. 2004;4:378–383. - PubMed
    1. Racusen L. Chronic transplant glomerulopathy: need for further assessment. Clin J Am Soc Nephrol. 2007;2:1108–1109. - PubMed
    1. Mauiyyedi S, Pelle PD, Saidman S, Collins AB, Pascual M, Tolkoff-Rubin NE, Williams WW, Cosimi AA, Schneeberger EE, Colvin RB. Chronic humoral rejection: identification of antibody-mediated chronic renal allograft rejection by C4d deposits in peritubular capillaries. J Am Soc Nephrol. 2001;12:574–582. - PubMed
    1. Regele H, Bohmig GA, Habicht A, Gollowitzer D, Schillinger M, Rockenschaub S, Watschinger B, Kerjaschki D, Exner M. Capillary deposition of complement split product C4d in renal allografts is associated with basement membrane injury in peritubular and glomerular capillaries: a contribution of humoral immunity to chronic allograft rejection. J Am Soc Nephrol. 2002;13:2371–2380. - PubMed
    1. Sis B, Campbell PM, Mueller T, Hunter C, Cockfield SM, Cruz J, Meng C, Wishart D, Solez K, Halloran PF. Transplant glomerulopathy, late antibody-mediated rejection and the ABCD tetrad in kidney allograft biopsies for cause. Am J Transplant. 2007;7:1743–1752. - PubMed

Publication types