. 2010 Oct 1;26(19):2363-7.
doi: 10.1093/bioinformatics/btq431. Epub 2010 Aug 5.

A framework for oligonucleotide microarray preprocessing

Affiliations

A framework for oligonucleotide microarray preprocessing

Benilton S Carvalho et al. Bioinformatics. .

Abstract

Motivation: The availability of flexible open source software for the analysis of gene expression raw level data has greatly facilitated the development of widely used preprocessing methods for these technologies. However, the expansion of microarray applications has exposed the limitation of existing tools.

Results: We developed the oligo package to provide a more general solution that supports a wide range of applications. The package is based on the BioConductor principles of transparency, reproducibility and efficiency of development. It extends the existing tools and leverages existing code for visualization, accessing data and widely used preprocessing routines. The oligo package implements a unified paradigm for preprocessing data and interfaces with other BioConductor tools for downstream analysis. Our infrastructure is general and can be used by other BioConductor packages.

Availability: The oligo package is freely available through BioConductor, http://www.bioconductor.org.


Figures
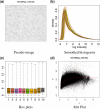
Fig. 1.
Fig. 1.
The oligo package provides several tools for the visualization of raw data, represented in the package through the FeatureSet subclasses. In (a), the pseudo-image can be used to visually inspect the data for spatial artifacts. Using oligo, one can produce such figures using the image method. (b) shows the smoothed histogram, implemented in oligo via the hist method, providing a way to compare the distribution of intensities across multiple samples. In (c), we show boxplots generated with the boxplot method, also used to assess the data distribution. The MAplot method can be used to generate the MA plot shown in (d), used to assess the dependency of log-ratios on the average log-intensity of the data.
Fig. 2.
Fig. 2.
The package is tightly integrated with other BioConductor tools to improve the user experience. (a) shows the affinity profile, which can be produced with oligo. In this figure, we can easily observe the clear interaction of nucleotide and position on the log2-intensity. For (b), storing sequence information using the DNAStringSet class in Biostrings provides a compact representation of the data and allow efficient calculation, as shown above with the log2-intensity boxplot stratified by GC content.
Fig. 3.
Fig. 3.
Log-ratio data used by CRLMM for genotype calling, which can be seriously affected by probe effects. In this plot, genotype calls provided by oligo are represented in different colors (black, AA; red, AB; green, BB) and each point represents one sample. SNP_A-1703121 shows significant discrimination on both strands and, as competing algorithms, CRLMM has excellent performance on similar scenarios. SNP_A-1725330 presents poor discrimination on the sense strand, because CRLMM does not average across strands, it can successfully predict the genotype calls. In comparable situations, competing algorithms are known to fail.
Fig. 4.
Fig. 4.
Visual representation of the observed log2-intensities and summarized data at the exon level for a fragment of gene ENSG00000131748. On the top panel of the figure, each line represents one different sample; the vertical bins represent the start and end positions for each probe (first subfigure) and probeset (second subfigure). On the bottom panel, the block diagram shows the probes, gene and transcript, respectively, in green, orange and blue. Here, the oligo, biomaRt, Biostrings, BSgenome and GenomeGraphs packages were used together to provide an improved visualization of the data at a specific genomic location.

Similar articles

Cited by

References

    1. Bolstad BM, et al. A comparison of normalization methods for high density oligonucleotide array data based on variance and bias. Bioinformatics. 2003;19:185–193. - PubMed
    1. Carvalho BS, et al. Exploration, normalization, and genotype calls of high-density oligonucleotide SNP array data. Biostatistics. 2007;8:485–499. - PubMed
    1. Carvalho BS, et al. Quantifying uncertainty in genotype calls. Bioinformatics. 2010;26:242–249. - PMC - PubMed
    1. Clark TA, et al. Discovery of tissue-specific exons using comprehensive human exon microarrays. Genome Biol. 2007;8:R64. - PMC - PubMed
    1. Gautier L, et al. affy—analysis of affymetrix genechip data at the probe level. Bioinformatics. 2004;20:307–315. - PubMed

Publication types

Substances