

Phosphorylation of G protein-coupled receptor kinase 2-interacting protein 1 tyrosine 392 is required for phospholipase C-gamma activation and podosome formation in vascular smooth muscle cells
- PMID: 20689073
- PMCID: PMC2941990
- DOI: 10.1161/ATVBAHA.110.212415
Phosphorylation of G protein-coupled receptor kinase 2-interacting protein 1 tyrosine 392 is required for phospholipase C-gamma activation and podosome formation in vascular smooth muscle cells
Abstract
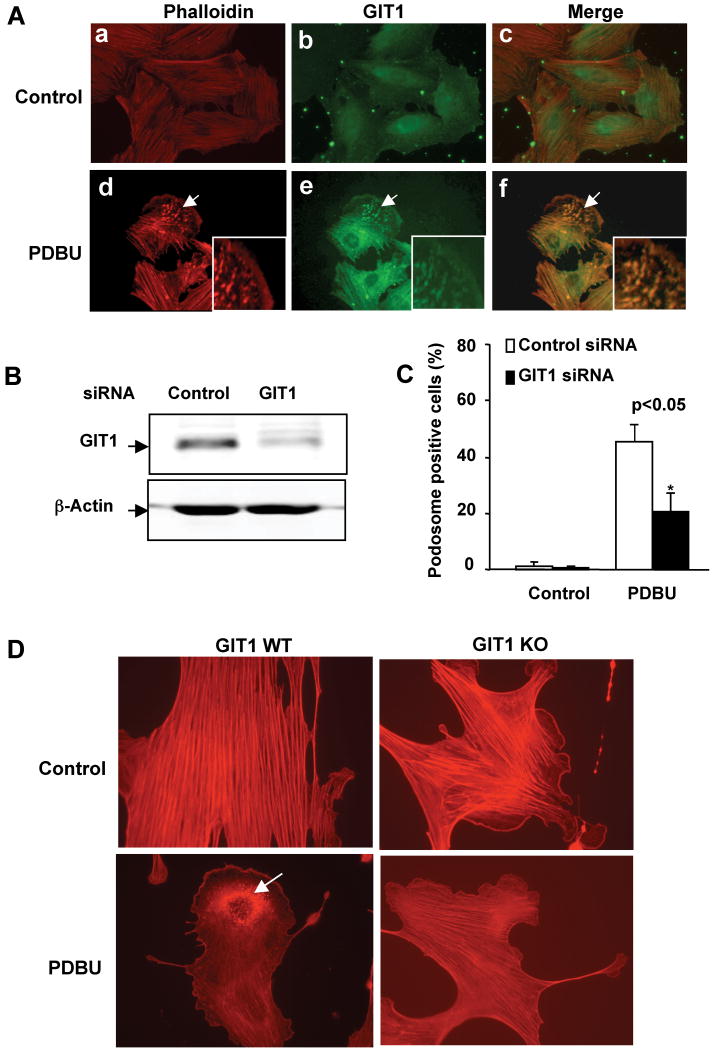
Objective: Podosomes, which are actin-rich structures, contribute to cell motility, matrix remodeling, and tissue remodeling. We have shown that G protein-coupled receptor kinase 2-interacting protein 1 (GIT1) colocalizes with podosomes and is important in podosome formation in endothelial cells. Src stimulates GIT1 tyrosine phosphorylation, which is critical for phospholipase C-γ (PLCγ) activation. In this study, we identified specific GIT1 tyrosines required for PLCγ activation and podosome formation in vascular smooth muscle cells (VSMC).
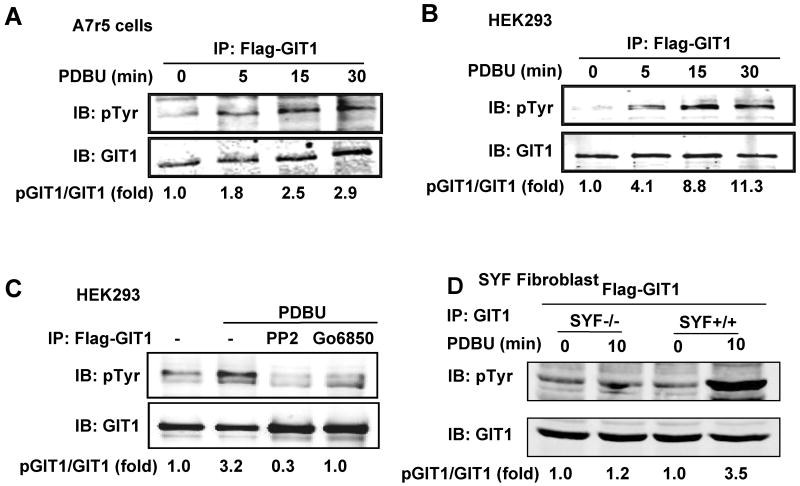
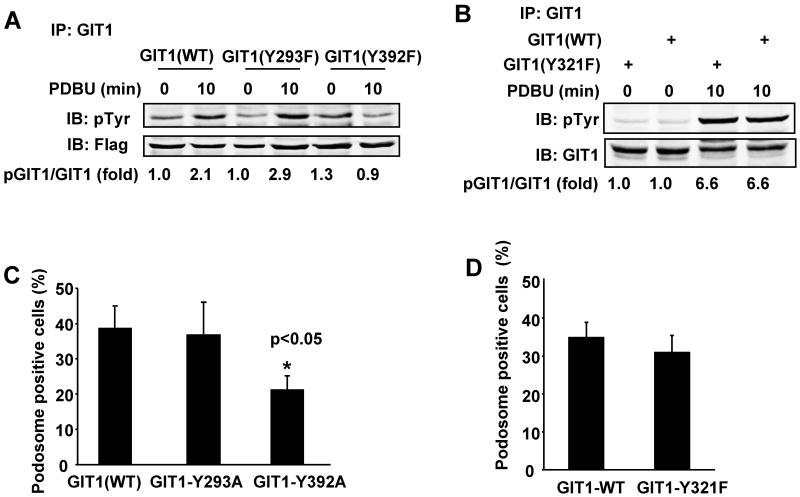
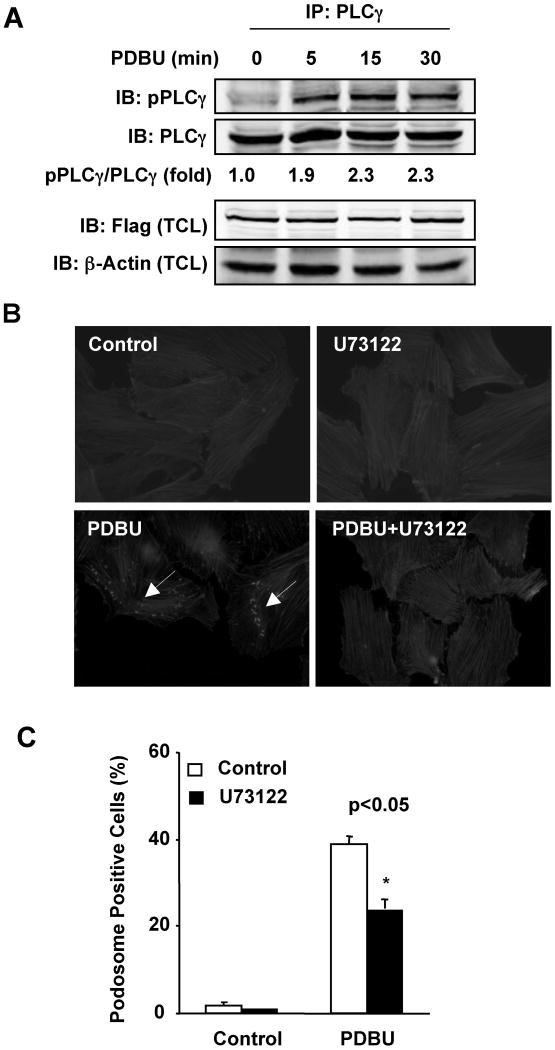
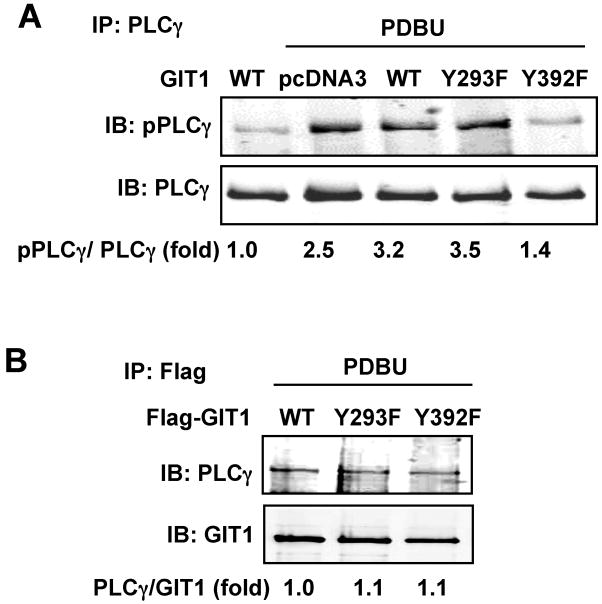
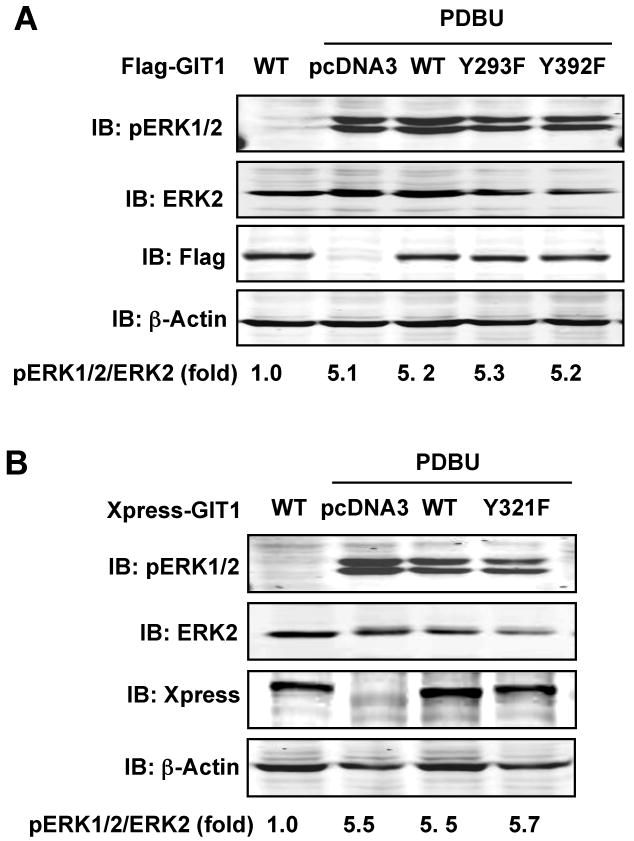
Methods and results: We used phorbol 12,13-dibutyrate (PDBU) to induce podosomes in A7r5 VSMC. GIT1 colocalized with podosomes and GIT1 knockdown using short interfering RNA significantly reduced podosome formation. PDBU stimulated GIT1 tyrosine phosphorylation. GIT1 tyrosine phosphorylation was dramatically decreased in SYF-/- cells, and it was also reduced by pretreatment with the protein kinase C (PKC) and Src inhibitors, suggesting that GIT1 phosphorylation was dependent on PKC and Src. By mutation analysis of multiple tyrosines, we found that PDBU specifically increased GIT1-Y392 phosphorylation. Overexpression of GIT1 (Y392F) but not of GIT1 (Y321F) decreased PDBU-mediated PLCγ activation and podosome formation without effect on extracellular signal-regulated kinase 1/2 activation. Additionally, we provide evidence that GIT1 knockout VSMC have markedly fewer podosomes on PDBU treatment compared with wild-type VSMC. These data show that GIT1 is a key regulator of podosome formation in VSMC.
Conclusions: In conclusion, our data suggest that GIT1-Y392 phosphorylation is critical for PDBU-induced podosome formation by regulating PLCγ activation. We propose that specific signaling modules are assembled in a GIT1 phosphotyrosine-dependent manner as exemplified by PLCγ activation versus extracellular signal-regulated kinase 1/2 activation.
Figures
Similar articles
-
GIT1 mediates VEGF-induced podosome formation in endothelial cells: critical role for PLCgamma.Arterioscler Thromb Vasc Biol. 2009 Feb;29(2):202-8. doi: 10.1161/ATVBAHA.108.174391. Epub 2008 Nov 20. Arterioscler Thromb Vasc Biol. 2009. PMID: 19023093 Free PMC article.
-
GIT1 mediates Src-dependent activation of phospholipase Cgamma by angiotensin II and epidermal growth factor.J Biol Chem. 2003 Dec 12;278(50):49936-44. doi: 10.1074/jbc.M307317200. Epub 2003 Sep 30. J Biol Chem. 2003. PMID: 14523024
-
Effects of tyrosine phosphorylation of cortactin on podosome formation in A7r5 vascular smooth muscle cells.Am J Physiol Cell Physiol. 2006 Feb;290(2):C463-71. doi: 10.1152/ajpcell.00350.2005. Epub 2005 Sep 14. Am J Physiol Cell Physiol. 2006. PMID: 16162656
-
p53 regulation of podosome formation and cellular invasion in vascular smooth muscle cells.Cell Adh Migr. 2011 Mar-Apr;5(2):144-9. doi: 10.4161/cam.5.2.14375. Epub 2011 Mar 1. Cell Adh Migr. 2011. PMID: 21164280 Free PMC article. Review.
-
Signaling networks regulating leukocyte podosome dynamics and function.Cell Signal. 2011 Aug;23(8):1225-34. doi: 10.1016/j.cellsig.2011.02.004. Epub 2011 Feb 20. Cell Signal. 2011. PMID: 21342664 Free PMC article. Review.
Cited by
-
Endothelial nitric-oxide synthase (eNOS) is activated through G-protein-coupled receptor kinase-interacting protein 1 (GIT1) tyrosine phosphorylation and Src protein.J Biol Chem. 2014 Jun 27;289(26):18163-74. doi: 10.1074/jbc.M113.521203. Epub 2014 Apr 24. J Biol Chem. 2014. PMID: 24764294 Free PMC article.
-
Shengjie Tongyu Granule Inhibits Vascular Remodeling in ApoE-Gene-Knockout Mice.Evid Based Complement Alternat Med. 2012;2012:897875. doi: 10.1155/2012/897875. Epub 2012 Jun 28. Evid Based Complement Alternat Med. 2012. PMID: 22811752 Free PMC article.
-
Biophysical induction of vascular smooth muscle cell podosomes.PLoS One. 2015 Mar 18;10(3):e0119008. doi: 10.1371/journal.pone.0119008. eCollection 2015. PLoS One. 2015. PMID: 25785437 Free PMC article.
-
Spatiotemporal regulation of Src and its substrates at invadosomes.Eur J Cell Biol. 2012 Nov-Dec;91(11-12):878-88. doi: 10.1016/j.ejcb.2012.06.003. Epub 2012 Jul 22. Eur J Cell Biol. 2012. PMID: 22823952 Free PMC article. Review.
-
Nicotinic acetylcholine receptor mediates nicotine-induced actin cytoskeletal remodeling and extracellular matrix degradation by vascular smooth muscle cells.Vascul Pharmacol. 2013 Jan;58(1-2):87-97. doi: 10.1016/j.vph.2012.08.003. Epub 2012 Aug 23. Vascul Pharmacol. 2013. PMID: 22940282 Free PMC article.
References
-
- McNiven MA, Baldassarre M, Buccione R. The role of dynamin in the assembly and function of podosomes and invadopodia. Front Biosci. 2004;9:1944–1953. - PubMed
-
- Linder S, Aepfelbacher M. Podosomes: adhesion hot-spots of invasive cells. Trends Cell Biol. 2003;13:376–385. - PubMed
-
- Brown D, Dykes A, Black J, Thatcher S, Fultz ME, Wright GL. Differential actin isoform reorganization in the contracting A7r5 cell. Can J Physiol Pharmacol. 2006;84:867–875. - PubMed
-
- Hai CM, Hahne P, Harrington EO, Gimona M. Conventional protein kinase C mediates phorbol-dibutyrate-induced cytoskeletal remodeling in a7r5 smooth muscle cells. Exp Cell Res. 2002;280:64–74. - PubMed
Publication types
MeSH terms
Substances
Grants and funding
LinkOut - more resources
Full Text Sources
Molecular Biology Databases
Research Materials
Miscellaneous
