. 2010 Nov;109(5):1500-14.
doi: 10.1152/japplphysiol.00493.2010. Epub 2010 Aug 5.

Derivation of a finite-element model of lingual deformation during swallowing from the mechanics of mesoscale myofiber tracts obtained by MRI

Affiliations

Derivation of a finite-element model of lingual deformation during swallowing from the mechanics of mesoscale myofiber tracts obtained by MRI

Srboljub M Mijailovich et al. J Appl Physiol (1985). 2010 Nov.

Abstract

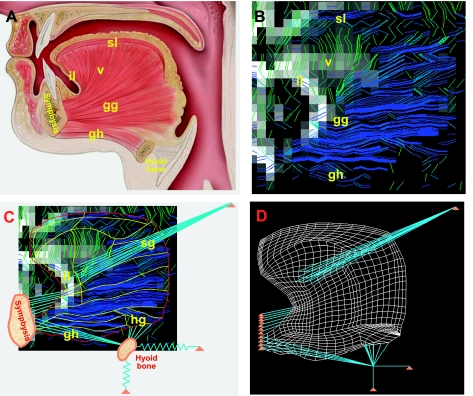
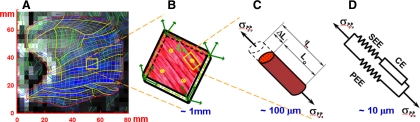
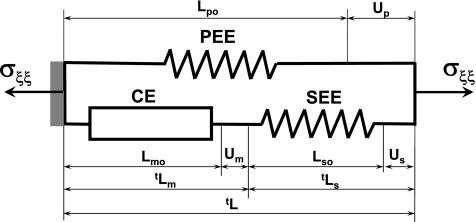
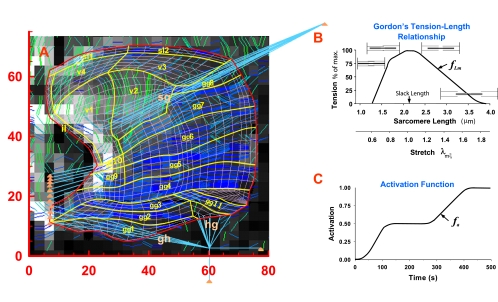
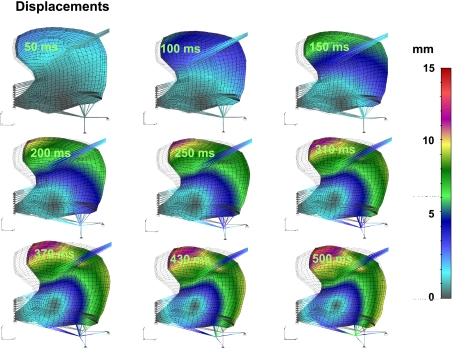
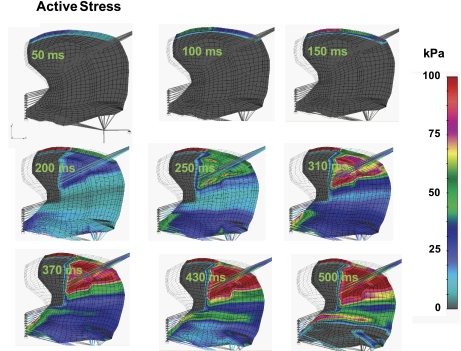
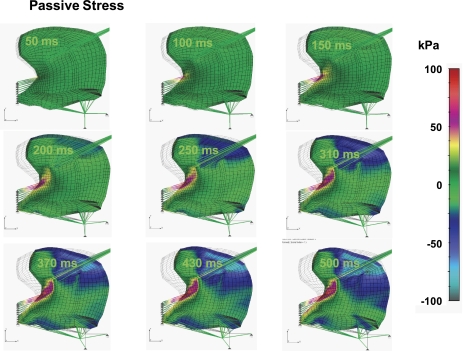
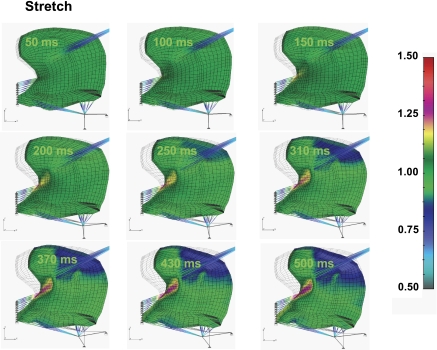
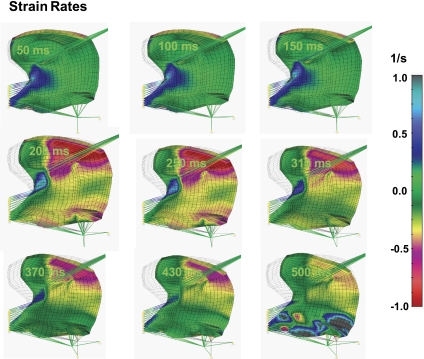
To demonstrate the relationship between lingual myoarchitecture and mechanics during swallowing, we performed a finite-element (FE) simulation of lingual deformation employing mesh aligned with the vector coordinates of myofiber tracts obtained by diffusion tensor imaging with tractography in humans. Material properties of individual elements were depicted in terms of Hill's three-component phenomenological model, assuming that the FE mesh was composed of anisotropic muscle and isotropic connective tissue. Moreover, the mechanical model accounted for elastic constraints by passive and active elements from the superior and inferior directions and the effect of out-of-plane muscles and connective tissue. Passive bolus effects were negligible. Myofiber tract activation was simulated over 500 ms in 1-ms steps following lingual tip association with the hard palate and incorporated specifically the accommodative and propulsive phases of the swallow. Examining the displacement field, active and passive muscle stress, elemental stretch, and strain rate relative to changes of global shape, we demonstrate that lingual reconfiguration during these swallow phases is characterized by (in sequence) the following: 1) lingual tip elevation and shortening in the anterior-posterior direction; 2) inferior displacement related to hyoglossus contraction at its inferior-most position; and 3) dominant clockwise rotation related to regional contraction of the genioglossus and contraction of the hyoglossus following anterior displacement. These simulations demonstrate that lingual deformation during the indicated phases of swallowing requires temporally patterned activation of intrinsic and extrinsic muscles and delineate a method to ascertain the mechanics of normal and pathological swallowing.


Figures

Fig. 1.
Fig. 1.
Development of finite element (FE) mesh from images of human lingual myofiber tracts obtained by diffusion tensor MRI with tractography. A: anatomy of the muscles present in the midsagittal plane of the tongue, shown in schematic view displaying several principal muscle groups and their bony attachments. Distinguished muscle groups include genioglossus (gg), verticalis (v), geniohyoid (gh), superior longitudinalis (sl), and inferior longitudinalis (il), with connections shown to the symphysis and the hyoid bones. B: diffusion tensor imaging (DTI) tractography images of myofiber tracts noted in A. For these imaging experiments, diffusion-weighted gradients were applied in 90 directions, employing single-shot echo-planar spatial encoding with repetition time = 3,000 ms, echo time = 80 ms, field of view 192 mm × 192 mm, slice thickness 3 mm, and b-value of 500 s/mm2, followed by the streamline construction of multivoxel myofiber tracts along the maximum diffusion vector per voxel. C: DTI tractography myofiber tracts displayed along with the points of insertion into midsagittal and non-midsagittal structures: geniohyoid (gh), hyoglossus (hg), styloglossus (sg), and inferior longitudinalis (il). D: FE mesh whose elemental alignment is derived from the principal diffusion direction per voxel obtained through DTI, including midsagittal and out-of-plane muscles, as well as boundary conditions such as attachments to the symphysis and hyoid bones. Note specifically that the hyoid bone is attached to fixed structures via elastic (connective tissue) structures.
Fig. 2.
Fig. 2.
Multiscale model of tongue contraction, displayed in the manner in which lingual mechanical function is characterized across relevant spatial scales. A: DTI tractography image of the midsagittal plane of the tongue discretized into FEs. Actual tongue dimensions are denoted along horizontal and vertical axis in millimeters. B: diagram depicting the muscle fibers contained within a characteristic three-dimensional (3D) FE, including denoted integration points and the principal direction muscle fibers, ξ. C: elongation of an individual muscle fiber at the indicated spatial scale under stress is denoted by σξξ. L, length; ΔL, change in length; tL, length at current time t; Lo, slack (relaxed) length. D: Hill's three-element model, displayed as the contractile element (CE) connected to series elastic elements (SEE) and parallel elastic elements (PEE).
Fig. 3.
Fig. 3.
Hill's functional model of skeletal muscle. Muscle mechanical function will be represented in terms of the Hill's phenomenological model. By this model, active muscle is composed of three elements: CE, SEE, and PEE. CE represents contractile (sarcomeric) part of muscle, which generates active force and increases overall muscle stiffness. In the relaxed state, this element generates zero tension and zero stiffness. The SEE includes the elasticity of actin and myosin filaments and tendons, and the PEE includes the elasticity of the surrounding connective tissue and the elasticity of the noncontractile part of the muscle cell's cytoskeleton. The lengths of CE, SEE, and PEE in the relaxed state are denoted as Lmo, Lso, and Lpo, respectively. The relaxed muscle length is equal to Lpo = Lmo + Lso. The lengths of the Hill's model components during contraction are tLm = Lmo + tUm, tLs = Lso + tUs and tLp = Lpo + tUp, where tUm, tUs, and tUp are displacements, i.e., change of length from undeformed configuration of CE, SEE, and PEE, respectively.
Fig. 4.
Fig. 4.
The FEs mesh and assigned mechanical characteristics in the Gaussian points for each FE. A: the mesh overlaid on the original DTI image slice. The thick yellow lines indicate muscle fiber groups for which mechanical characteristic are assigned. The specific muscle groups and subgroups employed in the current simulations are identified. B: Gordon's tension-length relationship indicates the fraction of the active muscle tension at arbitrary length, tL, in relation to the tension at a slack (relaxed) length, Lo. Muscle length can be prescribed as a sarcomere length at a micrometer scale that, after normalization by the slack length, can be represented as stretch, λ, at the macroscopic scale. C: activation function denotes fraction of the isometric force at time t to the maximum active force that can be generated at the same length, tL. The tabular values of the activation functions associated with the FE groups denoted in A are shown in Table 1. fLm, maximum isometric force and muscle length; fa, activation function.
Fig. 5.
Fig. 5.
Simulated displacement field relative to tissue deformation during swallowing. For Figs. 5–9, the deformed mesh (black lines) is superimposed on the original mesh (gray lines in background) for perspective to the initial configuration of the tongue. Elemental displacement is defined as a vector of the difference between current position of a material position (at time t) and the position of the same point in initial configuration (at t = 0). The color code represents magnitude of the displacement vector in millimeters. Shown is prototypical lingual deformation during swallowing, initiating with lingual tip contact with the hard palate and extending through the accommodative and propulsive phases. These results demonstrate the significance of the upward deformation of the lingual tip and anterior-posterior shortening, followed by inferior displacement (principally related to hyoglossus contraction) and clockwise rotation (principally related to superior-inferior sequential contractions of the genioglossus regions).
Fig. 6.
Fig. 6.
Simulated active muscle stress during swallowing. Active stress is defined in Eq. 8 and denoted as σm. The color code represents the magnitude of active muscle tension (kPa) in the direction of muscle fibers ξ. The dominant patters of active stress (largest magnitude) is associated with lingual rotation about the genioid process and is associated with sequential regional contraction of the regions of the genioglossus.
Fig. 7.
Fig. 7.
Simulated passive stress field during swallowing. Passive stress is defined by Eq. 12 and represents the stress in the parallel elastic element, σξξE, in direction of muscle fiber ξ. The color code represents the magnitude of σξξE in kilopascals. σE is the passive stress tensor, and σξξE is the most relevant component of this tensor. These results demonstrate that, within the current two-dimensional framework, passive stress tends to align with active stress in the apparent distribution of the superior regions of the genioglossus. The passive stress in both the longitudinal and the transverse directions considers only the passive elasticity and does not account for the increase of stiffness during contraction caused by bound cross bridges.
Fig. 8.
Fig. 8.
Simulated local stretch during swallowing. Local stretch is defined as λp = tLp/Lop = (1 + tUp)/Lop. Because, as the length of parallel elastic component is equal to the muscle length (Fig. 3), i.e., tLp = tL, the local parallel elastic stretch λp is equal to macroscopic stretch in Gaussian point of a FE, λ (Eq. A1). The color code represents the magnitude of the muscle stretch in direction of muscle fibers ξ. Stretch in the direction of indicated muscle fibers may be displayed as regions of compression (gray) or extension (red). The pattern of stretch displayed is similar to that exhibited by passive stress (Fig. 7), although relative magnitudes are skewed due to material and geometric nonlinearities.
Fig. 9.
Fig. 9.
Simulated local strain rate during swallowing. Local strain rate is computed to serve as a comparison with prior experimental work deriving aligned strain rate from lingual pressure-gated phase-contrast MRI and DTI tractography (4, 5). In the current simulation, local strain rate is calculated as a difference between consecutive images of the local stretches divided by time intervals between times when these images were obtained. The images of local stretches were collected at 1-ms intervals, and then the strain rates were collected at specified times denoted in the left corners of the presented images. The color code represents the magnitude of the strain rate in direction of muscle fibers ξ. Strain rate is displayed as regions of contraction rates (red) or elongation rates (gray).

Similar articles

Cited by

References

    1. Basser PJ, Mattiello J, LeBihan D. MR diffusion tensor spectroscopy and imaging. Biophys J 66: 259–267, 1994 - PMC - PubMed
    1. Bathe KJ. Finite Element Procedures. Englewood Cliffs, NJ: Prentice-Hall, 1996
    1. Doran GA. Review of the evolution and phylogeny of the mammalian tongue. Acta Anat (Basel) 91: 118–129, 1975 - PubMed
    1. Felton SM, Gaige TA, Benner T, Wang R, Wedeen VJ, Reese TG, Gilbert RJ. Association of mesoscale myofiber architecture with local strain rate during the propulsive phase of human swallowing. J Biomech 41: 1782–1789, 2008 - PubMed
    1. Felton SM, Gaige TA, Reese TG, Wedeen VJ, Gilbert RJ. Mechanical basis for lingual deformation during the propulsive phase of swallowing as determined by phase-contrast magnetic resonance imaging. J Appl Physiol 103: 255–265, 2007 - PubMed

Publication types