. 2011 Feb;18(2):248-58.
doi: 10.1038/cdd.2010.91. Epub 2010 Aug 6.

p53 directly transactivates Δ133p53α, regulating cell fate outcome in response to DNA damage

Affiliations

p53 directly transactivates Δ133p53α, regulating cell fate outcome in response to DNA damage

M Aoubala et al. Cell Death Differ. 2011 Feb.

Abstract

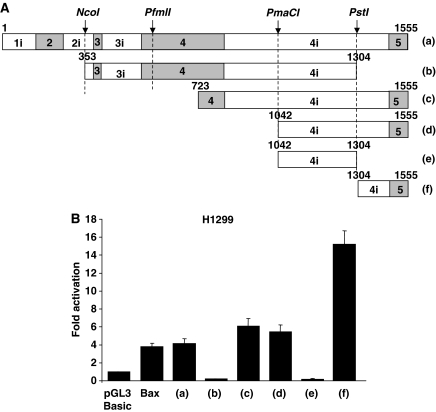
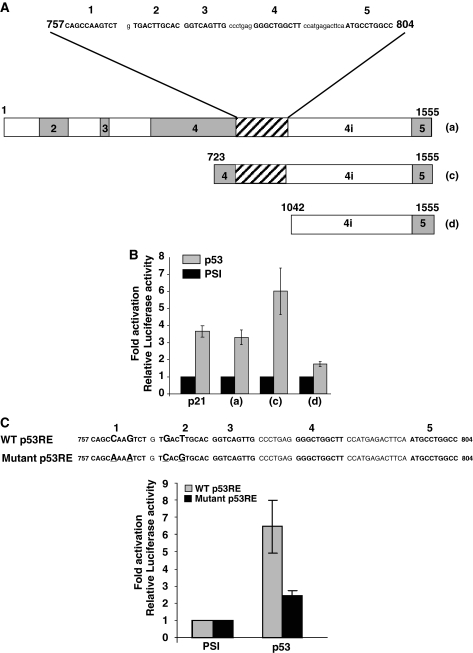
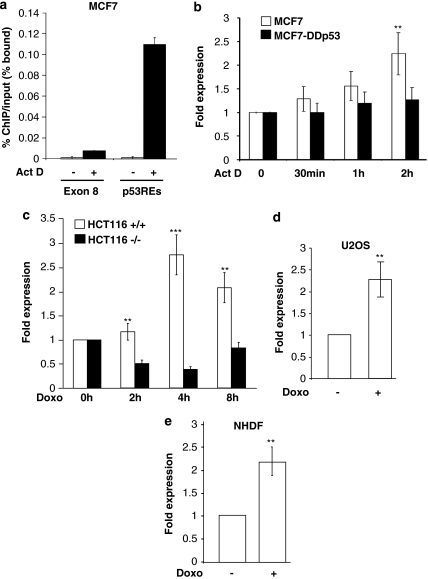
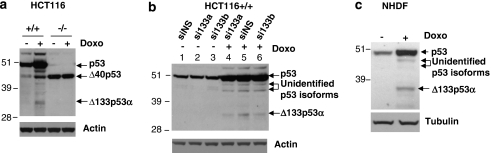
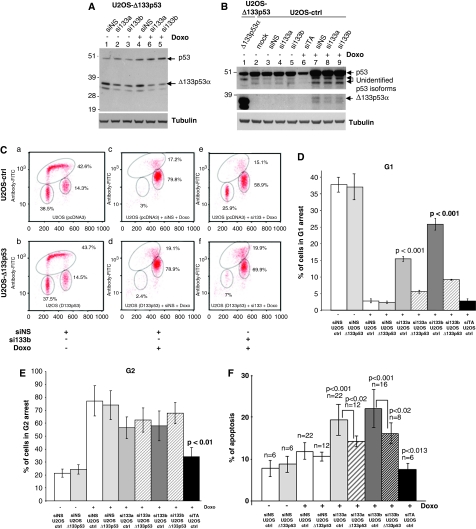
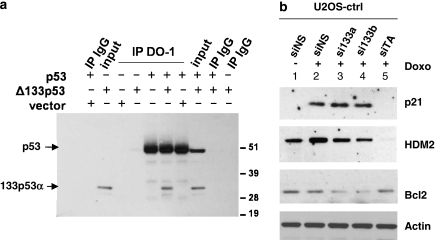
We have previously reported that the human p53 gene encodes at least nine different p53 isoforms, including Δ133p53α, which can modulate p53 transcriptional activity and apoptosis. In this study, we aimed to investigate the regulation of Δ133p53α isoform expression and its physiological role in modulating cell cycle arrest and apoptosis. We report here that in response to a low dose of doxorubicin (which induces cell cycle arrest without promoting apoptosis), p53 directly transactivates the human p53 internal promoter, inducing Δ133p53α protein expression. The induced Δ133p53α then inhibits p53-dependent apoptosis and G1 arrest without inhibiting p53-dependent G2 arrest. Therefore, endogenous Δ133p53α does not exclusively function in a dominant-negative manner toward p53, but differentially regulates cell cycle arrest and apoptosis.


Figures

Figure 1
Figure 1
Mapping of the promoter activity within intron-4 of the p53 gene. (A) Diagram showing the different p53 internal promoter deletion constructs (a–f), generated as described in Materials and Methods. Positions of the different restriction enzymes and size of the fragments obtained are indicated. Numbers of p53 introns and exons (empty and shadow boxes, respectively) are indicated. (B) Basal activity of each p53 internal promoter deletion construct (a–f). H1299 cells were co-transfected with each of the p53 internal promoter deletion constructs (a–f) and the Renilla luciferase reporter plasmid. The dual luciferase assay was then performed, as described in Materials and Methods. Each experiment was performed in duplicate and all results shown are the average of at least three separate individual experiments. The promoterless pGL3-basic plasmid was used as a negative control and pBax-luc plasmid was used as a positive control for the luciferase promoter activity. All activities were normalized to pGL3-basic activity
Figure 2
Figure 2
Identification and characterization of five p53REs within the p53 internal promoter. (A) Diagram showing the identified p53REs (written in bold and in capital letters within the region of 757–804 bp). Constructs with (a, c) or without (d) the p53REs were generated, as described in Materials and Methods. p53 introns and exons (empty and shadow boxes, respectively) are indicated. 4i corresponds to intron-4. p53RE region is indicated with a dashed box. (B) Induction of the p53 internal promoter by p53. H1299 cells were co-transfected with each of the p53 internal promoter constructs (a, c and d) and the p53 expression vector or the empty expression vector pSI. The dual luciferase assay was then performed, each experiment was performed in duplicate and all results shown are the average of at least three separate individual experiments. The p53-inducible p21 promoter cloned upstream of the luciferase gene was used as a positive control (p21). All luciferase activities were normalized to the basal activity obtained with the empty pSI plasmid and are represented as fold activation. (C) Four single point mutations (underlined) were generated within the first two p53REs of the pi3i4-luc construct (A, a). WT p53RE and Mutant p53RE sequences are illustrated. H1299 were co-transfected with the pi3i4-luc construct (WT p53RE or Mutant p53RE) and the p53 expression vector or the empty expression vector PSI. The dual luciferase assay was then performed, each experiment was performed in duplicate and all results shown are the average of at least three separate individual experiments. All luciferase activities were normalized to the basal activity of the empty pSI plasmid and are represented as fold activation
Figure 3
Figure 3
Human p53 internal promoter is directly transactivated by p53. (a) ChIP assay of p53 internal promoter DNA was carried out by RT-qPCR in MCF7 cells that were left untreated or treated with 60 ng/ml of actinomycin D (Act D) and harvested 2 h after treatment, using primers encompassing the p53REs. Exon-8 amplification was performed as a negative control. The amounts of the p53 internal promoter contained in the input or immunoprecipitated with the DO-1 antibody were quantified by RT-qPCR, as previously described. The results are expressed as a percentage of promoter specifically immunoprecipitated by the DO-1 antibody, compared with the total amount of promoter contained in 10% of the input. The results shown are the average of three independent experiments. (be) Quantification of endogenous p53 internal promoter activity by RT-qPCR in human cancer cells (MCF7, MCF7-DDp53, HCT116−/−, HCT116+/+ and U2OS) or primary normal human dermal fibroblasts (NHDF). (b) MCF7 (WTp53) and MCF7-DDp53 (mutant p53) cells were left untreated or treated for 30 min, 1 h or 2 h with 60 ng/ml of Act D and harvested. (c) HCT116+/+ (WTp53) and HCT116−/− (devoid of FLp53 expression) cells were left untreated or treated for 1 h with 0.5 μM of doxorubicin (Doxo) and harvested at the indicated time (d) U2OS (WTp53) cells and (e) NHDF were left untreated or treated for 1 h with 0.5 μM of doxorubicin (Doxo) and harvested 24 h after treatment. Student's t-test was performed and P-values are indicated (the student's t-tests were determined by comparing the expression levels of the p53 internal promoter in cells treated with Act D or doxorubicin, to untreated cells). **P<0.01; ***P<0.001. For all RT-qPCR experiments, expression levels were normalized to TBP. Results are expressed as the fold change compared with untreated cells and represent mean±S.D. of three independent experiments
Figure 4
Figure 4
Δ133p53α protein is induced in response to doxorubicin treatment. (a) HCT116+/+ (p53WT) and HCT116−/− (devoid of FLp53 expression) cells were treated with 0.5 μM doxorubicin for 1 h and proteins were extracted 24 h after treatment in SDS-Laemmli buffer. Western blot analysis was performed using the CM1 rabbit polyclonal antibody, which recognizes all p53 isoforms. (b) HCT116+/+ transfected for 24 h with 50 nM of si133a, si133b (two distinct siRNAs specific for the 5′UTR of Δ133p53 mRNAs) or siNS (nonspecific siRNA used as a negative control), were left untreated (−) or treated (+) for 1 h with 0.5 μM of doxorubicin, as indicated. Proteins were extracted 24 h after treatment and analyzed by western blotting. p53 and its isoforms were revealed with the CM1 antibody. Actin was used as a protein loading control. (c) Western blot analysis of endogenous Δ133p53α expression in untreated (−) or doxorubicin-treated (+) NHDF cells. p53 and its isoforms were revealed with the CM1 antibody. Tubulin was used as a protein loading control
Figure 5
Figure 5
Δ133p53α antagonizes DNA damage-induced apoptosis and G1 arrest without preventing p53-dependent G2 cell cycle arrest. U2OS-ctrl and U2OS-Δ133p53 cells were generated after stable transfection with the empty pcDNA3 or the pcDNA3-Δ133p53 expression vectors, respectively, as described in Material and Methods. Cells transfected for 24 h with 50 nM of si133a, si133b, siTA (siRNA specific for FLp53) or siNS (as indicated), were left untreated (−) or treated (+) for 1 h with 0.5 μM of doxorubicin (Doxo), and incubated for a further 24 h before harvesting. Western blot analysis of U2OS-Δ133p53 cells (A) and U2OS-ctrl cells (B). p53 and its isoforms were revealed with the CM1 antibody. Tubulin was used as a protein loading control. C (a–f) Cell cycle analysis by flow cytometry after BrdU pulse labeling of U2OS-ctrl and U2OS-Δ133p53 cells treated as described above. These experiments were carried out in parallel with the western blot analyses described above and a representative BrdU pulse labeling experiment is shown (C). The average of the percentage of cells in G1 (D) and G2 (E) are shown. (F) Apoptosis assay. In parallel to the western blot analyses described above, cells were treated as described above and Annexin V-FITC flow cytometric analysis was carried out. The average of the percentage of apoptotic cells is shown. Student's t-test was performed and P-values are indicated (the student's t-tests were carried out by comparing percentages of U2OS-ctrl cells transfected with si133a, si133b or siTA, to percentages of U2OS-ctrl cells transfected with siNS, after doxorubicin treatment). All results shown are the average of at least three separate individual experiments
Figure 6
Figure 6
Δ133p53α directly interacts with p53 and differentially regulates p21, HDM2 and Bcl-2 expression. (a) Co-immunoprecipitation of Δ133p53α with p53. H1299 cells were transfected with pSV-p53 and/or pSV-Δ133p53α expression vectors, as indicated. Extracted proteins were immunoprecipitated with the mouse monoclonal antibody DO-1 or with a nonrelevant mouse monoclonal IgG antibody, as indicated. DO-1 is specific for FLp53 and does not bind Δ133p53α. Protein content was then analyzed by western blot analysis using the rabbit polyclonal antibody (CM1), recognizing FLp53 and Δ133p53α. 10% of the input was loaded as a control. (b) Western blot analysis of p53 target genes (p21, HDM2 and Bcl-2). In parallel to the cell cycle analysis and apoptosis assay, protein extracts from U2OS-ctrl cells treated as described in Figure 5B, were analyzed by western blotting using the corresponding antibodies. Actin was used as a protein loading control

Similar articles

Cited by

References

    1. Royds JA, Iacopetta B. p53 and disease: when the guardian angel fails. Cell Death Differ. 2006;13:1017–1026. - PubMed
    1. Braithwaite AW, Prives CL. p53: more research and more questions. Cell Death Differ. 2006;13:877–880. - PubMed
    1. Vousden KH, Lane DP. p53 in health and disease. Nat Rev Mol Cell Biol. 2007;8:275–283. - PubMed
    1. Lavin MF, Gueven N. The complexity of p53 stabilization and activation. Cell Death Differ. 2006;13:941–950. - PubMed
    1. Laptenko O, Prives C. Transcriptional regulation by p53: one protein, many possibilities. Cell Death Differ. 2006;13:951–961. - PubMed

Publication types