. 2010 Jul 30;5(7):e11909.
doi: 10.1371/journal.pone.0011909.

Oscillations by minimal bacterial suicide circuits reveal hidden facets of host-circuit physiology

Affiliations

Oscillations by minimal bacterial suicide circuits reveal hidden facets of host-circuit physiology

Philippe Marguet et al. PLoS One. .

Abstract

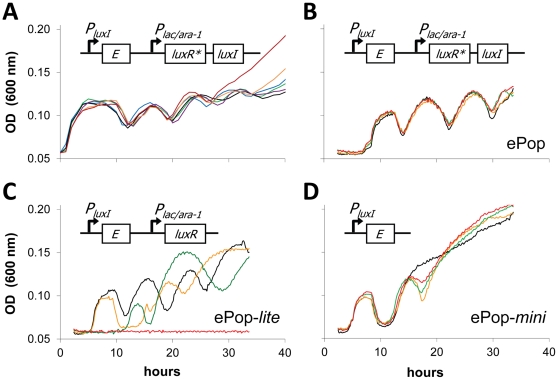
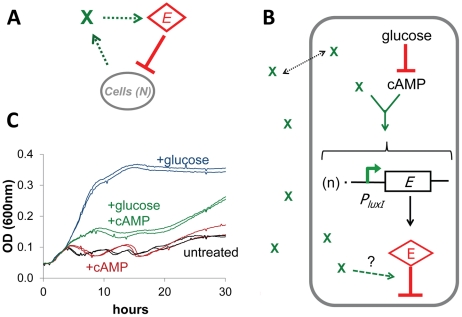
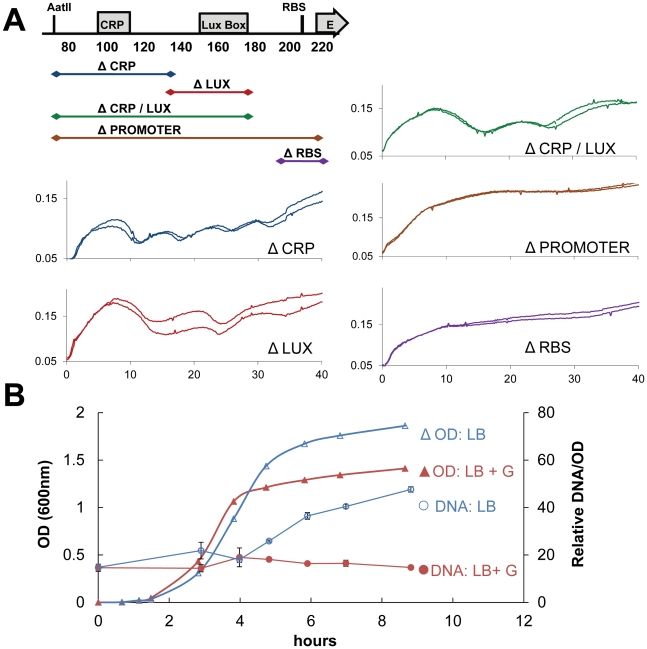
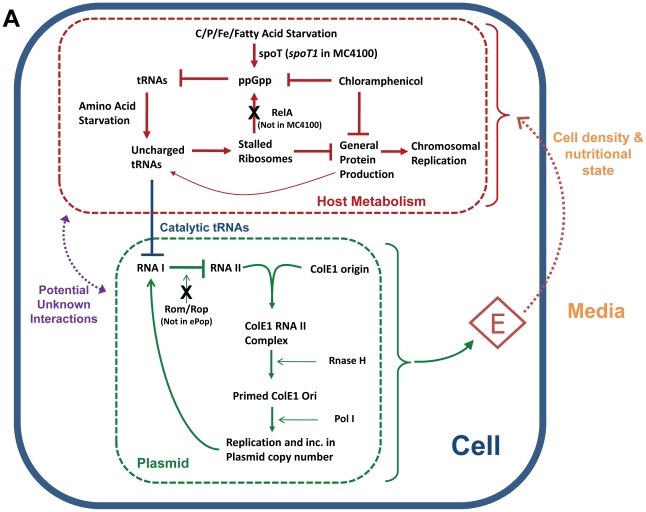
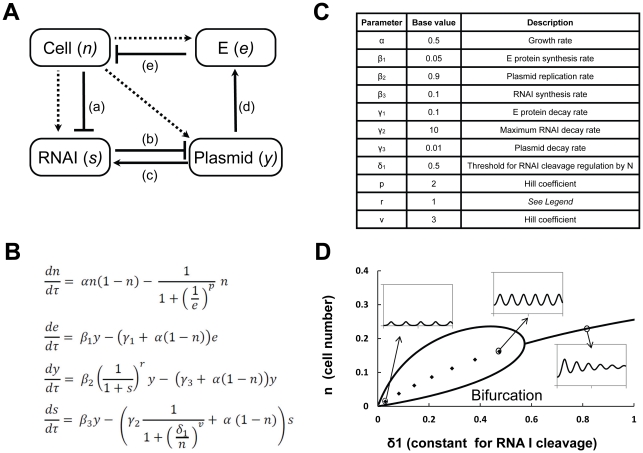
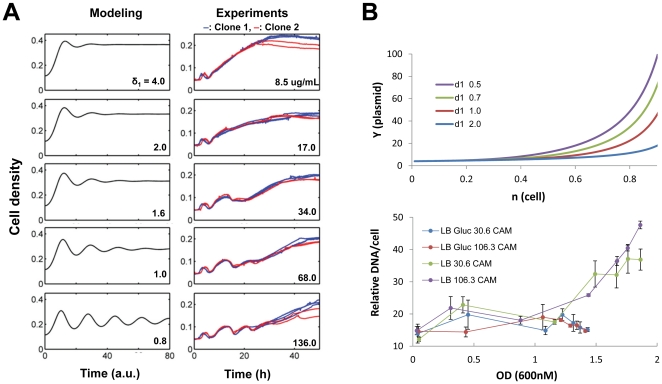
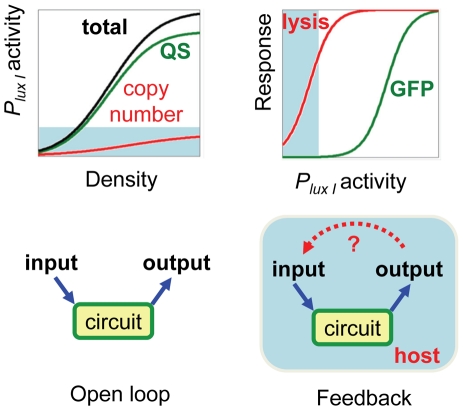
Synthetic biology seeks to enable programmed control of cellular behavior though engineered biological systems. These systems typically consist of synthetic circuits that function inside, and interact with, complex host cells possessing pre-existing metabolic and regulatory networks. Nevertheless, while designing systems, a simple well-defined interface between the synthetic gene circuit and the host is frequently assumed. We describe the generation of robust but unexpected oscillations in the densities of bacterium Escherichia coli populations by simple synthetic suicide circuits containing quorum components and a lysis gene. Contrary to design expectations, oscillations required neither the quorum sensing genes (luxR and luxI) nor known regulatory elements in the P(luxI) promoter. Instead, oscillations were likely due to density-dependent plasmid amplification that established a population-level negative feedback. A mathematical model based on this mechanism captures the key characteristics of oscillations, and model predictions regarding perturbations to plasmid amplification were experimentally validated. Our results underscore the importance of plasmid copy number and potential impact of "hidden interactions" on the behavior of engineered gene circuits - a major challenge for standardizing biological parts. As synthetic biology grows as a discipline, increasing value may be derived from tools that enable the assessment of parts in their final context.


Conflict of interest statement

Competing Interests: The authors have declared that no competing interests exist.

Figures

Figure 1
Figure 1. ePop dynamics in liquid culture.
(A) MC4100z1 cells containing the ePop circuit (top) grown in liquid culture exhibited regular oscillations in cell density (bottom). Each trace represents a culture started from an individual colony. (B–D) Cultures treated with AHL: red (1000nM), green (100 nM), yellow (10nM), and black (0 nM). (B) Cells containing ePop oscillated independent of AHL concentrations. (C) Cells containing ePop-lite oscillated, but showed dose-dependent sensitivity to AHL (D) Cells containing ePop-mini oscillated independent of AHL concentrations (although only two cycles of lysis were observed here, other experiments with this plasmid showed up to four cycles).
Figure 2
Figure 2. Possible sources of negative feedback.
(A) Sustained population oscillations require negative feedback at the population level mediated by an unknown signal (X) and time delay. (B) Model for activation of the PluxI promoter integrating information from cAMP and X, where n represents the plasmid copy number per cell. The dashed line indicates the potential for post translational regulation, which we cannot rule out as a possibility. (C) Glucose and cAMP were added to LB and the impact on oscillations recorded. 1% glucose (blue) abolished oscillations; 5mM cAMP (red) slightly affected oscillation period; cultures containing 1% glucose and 5mM cAMP (green) reached an intermediate density and regained some oscillation. Cultures containing no exogenous glucose or cAMP are shown in black.
Figure 3
Figure 3. Plasmid amplification rather than promoter regulation may be the cause of oscillations.
(A) Feedback is not at the promoter level. A promoter deletion series demonstrates that removal of the cAMP receptor site (ΔCRP), Lux box (ΔLUX), or both (ΔCRP/LUX) did not abolish oscillations. Deletion of the full promoter (ΔPROMOTER) did abolish oscillations, but this can be explained by deletion of the RNA polymerase binding site and ribosome binding site (ΔRBS). (B) OD (triangles) and miniprep yield (circles) from cells grown in LB (open symbols, blue) and LB + 0.2% glucose (closed symbols, red). Miniprep yield increases upon entry to stationary phase in the LB culture, but not in the glucose supplemented culture.
Figure 4
Figure 4. Modeling plasmid amplification, lysis, and oscillations.
The diagram shows stringent control, plasmid replication, and a possible mechanistic link. The host stringent response prepares E. coli cells for prolonged periods of nutritional limitation through the control of ppGpp levels , . Although the ppGpp response is multifaceted, for simplicity, only the regulation of tRNAs is shown. In wild-type cells ppGpp is either produced by RelA as a consequence of uncharged tRNAs resulting from amino acid starvation, or by SpoT in response to other nutritional stresses. However, because MC4100 cells are relaxed (relA1 allele) ppGpp is not produced in response to amino acid starvation and uncharged tRNA levels can accumulate to a greater degree. Uncharged tRNAs have been shown to degrade RNA I, the negative regulator of plasmid replication, in vitro, and lead to plasmid amplification when overexpressed in vivo . Indeed, relaxed hosts experience ColE1 plasmid amplification when starved for amino acids. Our observations on ePop are consistent with a model where uncharged tRNAs accumulate and plasmid is amplified at high cell density and nutrient limitation. Low nutrient goes unacknowledged by the cell because RelA is not present to sense uncharged tRNAs and chloramphenicol is present to inhibit ppGpp accumulation. Plasmid amplification leads to increased E expression, cell lysis, decreased population density, and subsequent release of nutrient limitation. Although this model can account for the observations, we cannot exclude the possibility that other interactions exist to provide alternate or additional linkage between host metabolism and plasmid replication.
Figure 5
Figure 5. A simplified model for ePop function.
(A) Solid lines indicate positive and negative regulation. Dashed lines represent the effect of cell growth on component dilution. a. Increasing cells density causes RNA I degradation (possibly through uncharged tRNAs. See Figure 4 for more details). b. RNA I inhibits plasmid replication (through its interaction with RNA II). c. RNA I is produced from the ePop plasmid; elevated plasmid levels increase RNA I production. d. E protein is produced from ePop plasmid by basal expression from the luxI promoter in the absence of functional LuxR. Elevated plasmid levels increase E protein production. e. E protein decreases cell density by blocking cell-wall synthesis and lysing cells. (B) Dimensionless ODE model of the circuit. Changes in cell density (n) are modeled as logistic growth with an intrinsic growth rate, α. We assume that killing of cells by the E protein is cooperative and describe it using a Hill-type function (Hill coefficient, p). We note that cooperatively of E protein-mediated killing is not required for generating oscillations. The E protein is produced from a plasmid (y) with a rate β1 and degraded with a rate γ1; both processes follow first-order kinetics with regards to the amount of plasmid and E protein, respectively. Plasmid replication is inhibited by RNA I (s), and replication inhibition follows a power of hyperbolic function where r is the effective number of reaction steps in the inhibitory scheme . β2 sets the maximum plasmid replication rate and γ3 the intrinsic decay rate. RNA I is produced from the plasmid with a rate β3 whereas its degradation rate is dependent on the cell density. Degradation of RNA I is described by a Hill-type function (Hill coefficient, v) to account for possible cooperativity. E protein, plasmid and RNA II are subject to dilution with cell growth. (C) The base parameter set that can generate sustained oscillations. Rate coefficients are normalized to a maximum killing rate (i.e. the maximum cell killing rate by E protein is 1). Biologically relevant parameter values have been chosen to illustrate the basic dynamics. E protein production rate β1 is set to be small to reflect leaky expression. Plasmid decay rate γ3 is set small to reflect the stability of plasmid molecules, and under oscillatory conditions plasmid dilution dominates. (D) Bifurcation diagram showing a region of sustained oscillations over varying ‘half-maximal constant for RNAI cleavage’ (δ1). Insets show simulated time courses of cell density for three δ1 values. Damped oscillations can be generated outside the bifurcation region.
Figure 6
Figure 6. Model predictions and experimental responses to system perturbations.
(A) Model predictions of increasing δ1 outside the bifurcation region on oscillations (left) match the result of decreasing chloramphenicol concentration (right), providing further support for the plasmid amplification mechanism. All chloramphenicol concentrations tested completely inhibited the growth of MC4100z1 cells without ePop and are therefore sufficient to prevent the growth of plasmid free segregates. (B) (top) Simulation of plasmid levels as a function of cell density in the absence of E protein (β1 set to 0). Increasing δ1 values result in depressed plasmid amplification. (bottom) Experimental data of plasmid amplification (plotted as DNA/cell as a function of OD) demonstrate adding glucose or lowing chloramphenicol concentrations have the apparent effect of increasing δ1. Glucose when present was used at 0.2% and chloramphenicol concentrations were 30.6µg/mL or 106 µg/mL. Coloring of traces is meant to demonstrate the trend and should not imply a direct quantitative agreement of specific model values with specific culturing conditions. The two traces at 106 µg/mL are from the same data as Figure 2B.
Figure 7
Figure 7. Gate matching and unexpected feedbacks.
(top) Total PluxI activity is the combination of plasmid amplification and quorum sensing. In ePop, defective LuxR prevents the contribution from quorum sensing - leaving only that of plasmid amplification. Low PluxI activity is sufficient to cause lysis, due to the extreme toxicity of the E gene. A more typical reporter used for promoter characterization (such as GFP) may be undetectable at this level, causing the effects of plasmid amplification to be missed. (bottom) A gene circuit can be designed as an open loop to process a series of inputs into defined outputs. When circuits are placed into host cells, however, hidden interactions between circuit and cellular components can introduce feedback that significantly impacts circuit dynamics. In ePop, the interaction between cell density and plasmid amplification is an unanticipated feedback that allows the circuit output (cell density) to serve as an input by modulating gene dosage.

Similar articles

Cited by

References

    1. Chin JW. Programming and engineering biological networks. Curr Opin Struct Biol. 2006;16:551–556. - PubMed
    1. Di Ventura B, Lemerle C, Michalodimitrakis K, Serrano L. From in vivo to in silico biology and back. Nature. 2006;443:527–533. - PubMed
    1. Drubin DA, Way JC, Silver PA. Designing biological systems. Genes Dev. 2007;21:242–254. - PubMed
    1. Marguet P, Balagadde F, Tan C, You L. Biology by design: reduction and synthesis of cellular components and behaviour. J R Soc Interface. 2007;4:607–623. - PMC - PubMed
    1. Sprinzak D, Elowitz MB. Reconstruction of genetic circuits. Nature. 2005;438:443–448. - PubMed

Publication types

MeSH terms