

doi: 10.1016/j.neucom.2005.12.029.
Spatio-temporal dynamics in fMRI recordings revealed with complex independent component analysis
Affiliations
- PMID: 20689619
- PMCID: PMC2916201
- DOI: 10.1016/j.neucom.2005.12.029
Item in Clipboard
Spatio-temporal dynamics in fMRI recordings revealed with complex independent component analysis
Neurocomputing (Amst).
.
Abstract
Independent component analysis (ICA) of functional magnetic resonance imaging (fMRI) data is commonly carried out under the assumption that each source may be represented as a spatially fixed pattern of activation, which leads to the instantaneous mixing model. To allow modeling patterns of spatio-temporal dynamics, in particular, the flow of oxygenated blood, we have developed a convolutive ICA approach: spatial complex ICA applied to frequency-domain fMRI data. In several frequency-bands, we identify components pertaining to activity in primary visual cortex (V1) and blood supply vessels. One such component, obtained in the 0.10 Hz band, is analyzed in detail and found to likely reflect flow of oxygenated blood in V1.
Figures
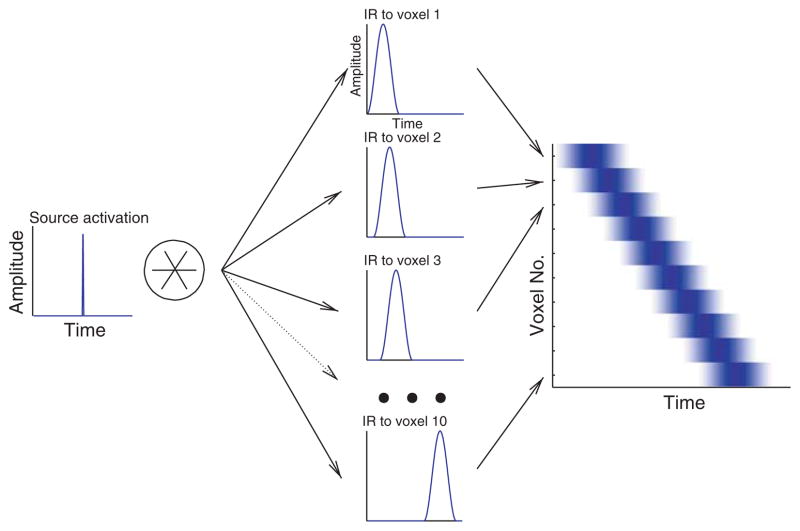
Spatio-temporal dynamics generated by a toy-example convolution model. An idealized, delta-shaped source activation (left) is convolved with several impulse responses (“IR”, center) which project the source activation to different fMRI voxels arranged on a line (right). Different time-lags and the temporal “smearing” introduced by the impulse responses result in the measurement of a spatio-temporal pattern at the voxels which is spatially extended and moves across the voxel array. By varying the impulse responses used, more complex spatio-temporal patterns may easily be generated.
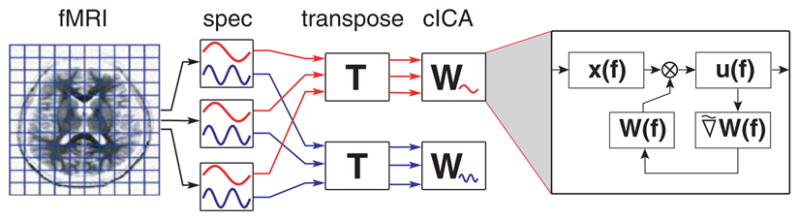
Schematic representation of the processing steps of the complex frequency-domain ICA algorithm. Voxel time-courses are recorded with an fMRI scanner (“fMRI”). The corresponding time-frequency representation is computed for each voxel using a (temporal) short-term Fourier transformations (“spec”). In order to apply the complex ICA in spatial (as opposed to temporal) decomposition mode, the data is rearranged (“transpose”) so that the number of short-term temporal windows determines input dimentionality and the number of voxels determines samples. Complex ICA is performed within each spectral band (“cICA”). The iteration steps of the complex ICA algorithm are depicted on the right.
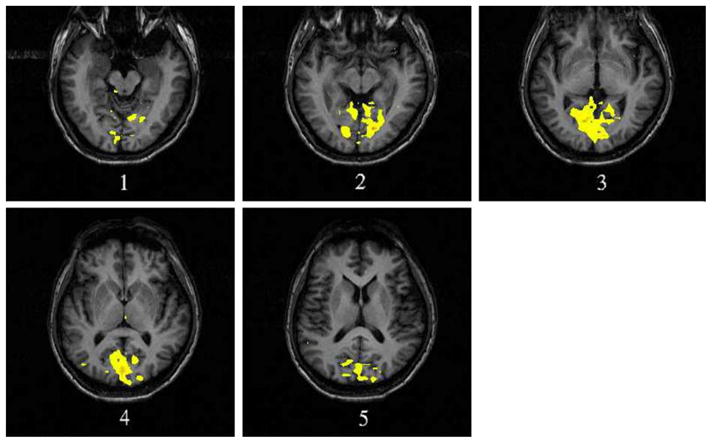
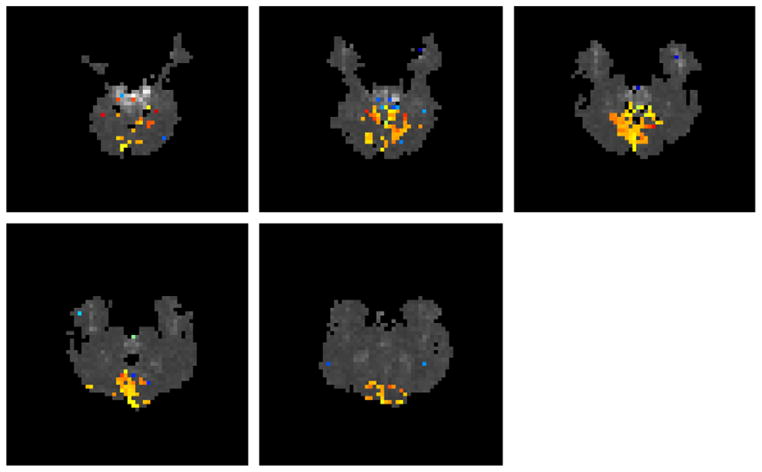
Magnitude map of the component region of activity (ROA) for complex component IC2 obtained by complex ICA in the 0.1 Hz frequency-band. The ROA extends over visual area V1 and blood supply vessels. Colors indicate component magnitude in the ROA. The structural image of the recorded areas is plotted in darker gray tones. The component ROA is interpolated to the higher resolution of the structural scan for better visualization. (Note: The electronic version of this document contains color figures for better visualization and can be obtained from the first author.)
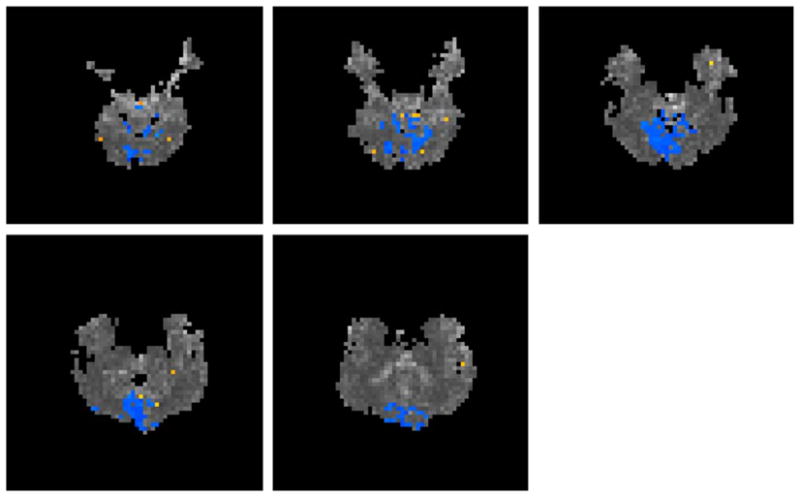
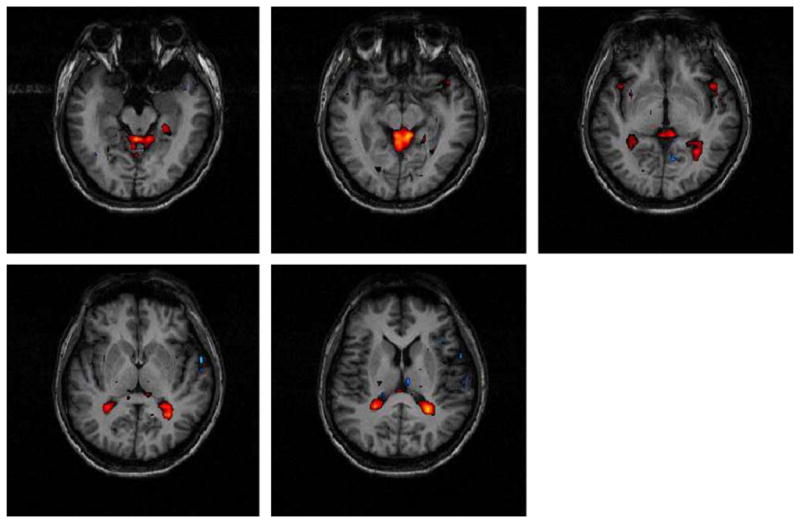
Magnitude map of the component ROA for complex component IC16 in the 0.05 Hz band. Colors indicate component magnitude in region of activity. Note that in contrast to Fig. 3 the information is displayed at the lower spatial resolution of the functional recordings.
Phase map of the component ROA for complex component IC16 in the 0.05 Hz band, corresponding to the magnitude map displayed in Fig. 4. Colors indicate component phase in region of activity.
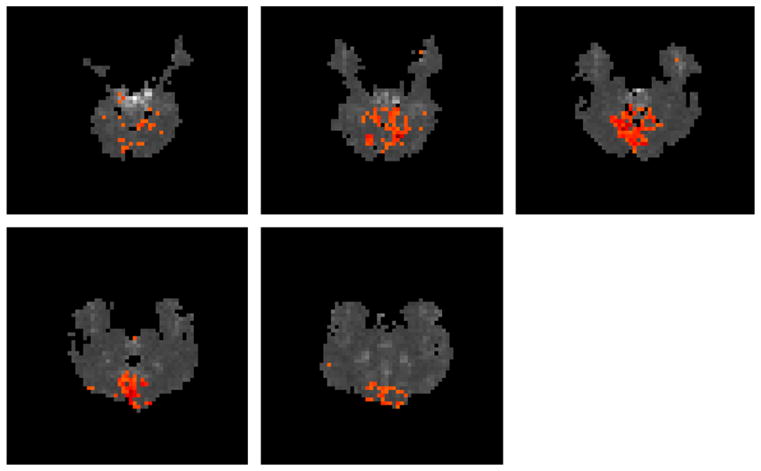
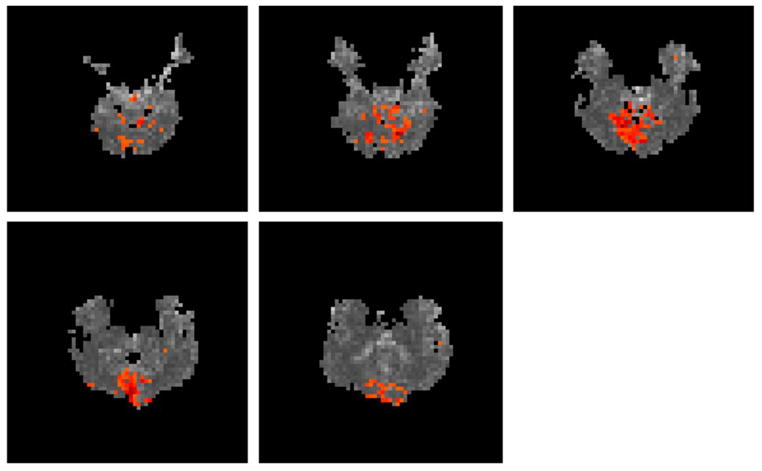
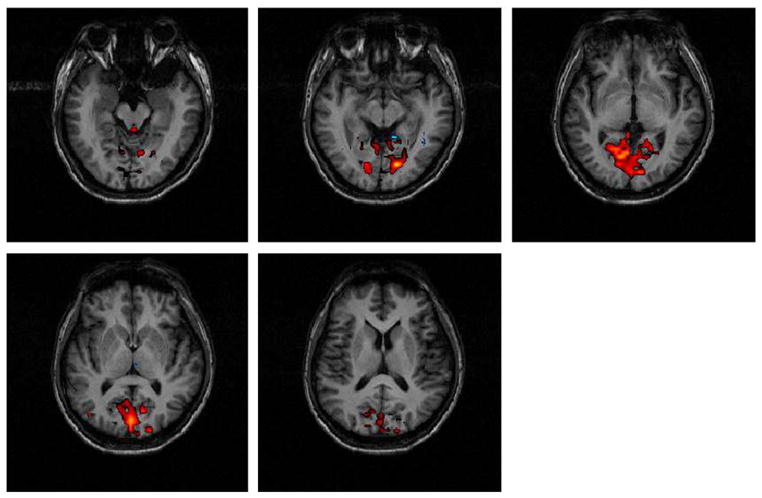
Magnitude map of the component ROA for complex component IC2 in the 0.10 Hz frequency-band. Colors indicate component magnitude in the ROA. The plot contains the same information as displayed in Fig. 3, but shown at the lower resolution of the functional scans and with a different colormap.
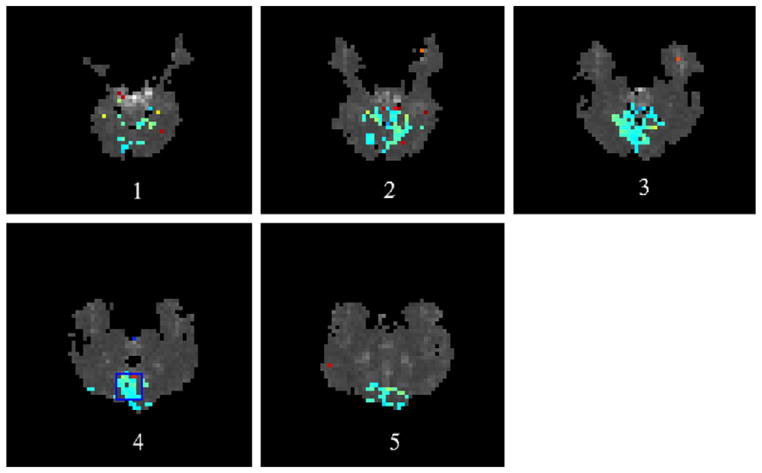
Phase map of the component ROA for complex component IC2 in the 0.10 Hz band, corresponding to the magnitude map displayed in Fig. 6. Colors indicate component phase in the ROA. The voxels marked by a blue square in slice 4 are investigated further in Fig. 11.
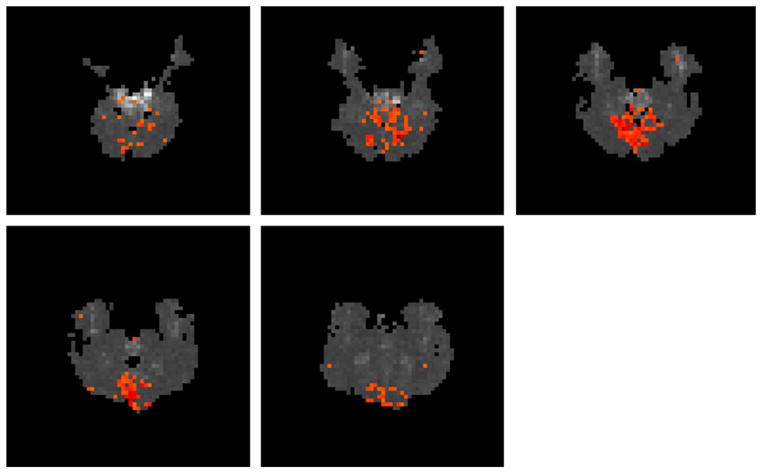
Magnitude map of the component ROA for complex component IC9 in the 0.15 Hz frequency-band. Colors indicate component magnitude in the ROA.
Phase map of the component ROA for complex component IC9 in the 0.15 Hz band, corresponding to the magnitude map displayed in Fig. 8. Colors indicate component phase in the ROA.
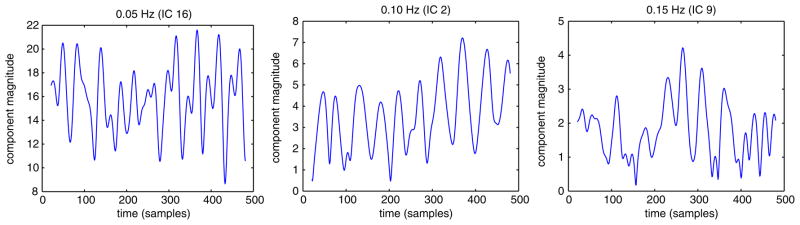
Time-course of component magnitude of complex component IC16 in the 0.05 Hz frequency-band (left), component IC2 at 0.10 Hz (center) and component IC9 at 0.15 Hz (right). Note the time-locking of amplitude and phase to stimulus presentation in 25 s intervals, in particular in component IC2 at 0.10 Hz. The first and last 10 s of the experiment are not shown because computation of the spectral components was stopped when the analysis window (length 20 s) reached the edges of the recording. The time-interval from 179.5 s to 187.0 s around the largest component magnitude peak of IC2 (center) is investigated further in Fig. 11.
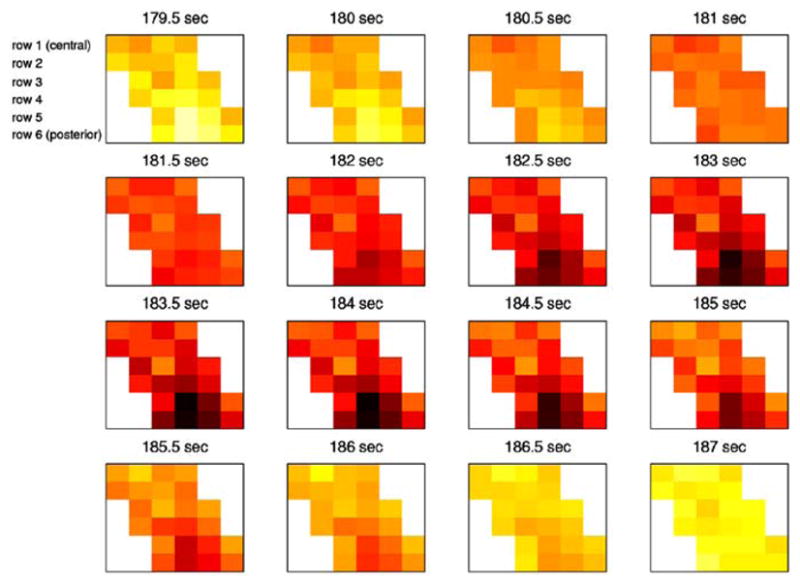
Backprojected component activity from complex component IC2 at 0.10 Hz. Complex component time-course was backprojected to corresponding activity at the voxels and transformed to the time-domain. Shown is the activity of 24 voxels in visual area V1, the position of which is marked by a blue box in slice 4 of Fig. 7. The flickering-checkerboard stimulus was presented for 3.0 s at experiment time 175.0 s (not shown). Activation started to increase with a time lag of about 4.5 s, with first increase occurring at the centrally-located voxels (top rows), and propagated to the posterior voxels (bottom rows) within approximately 1 s. This is compatible with over-supplied oxygenated blood propagating in the posterior direction and being washed out through the drainage vein from area V1.
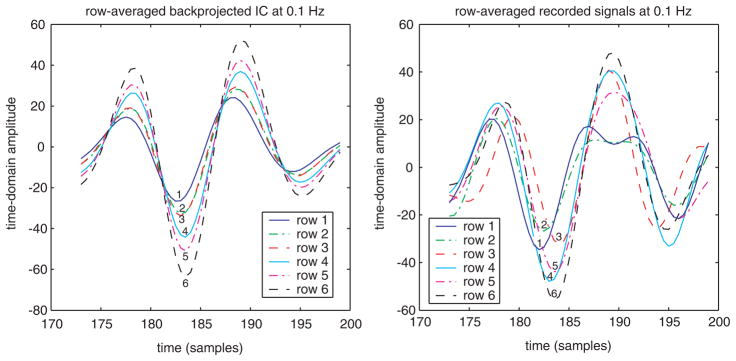
Left: Average time-courses near largest component power peak (at 184.5 s) for each row of 0.1 Hz band time-domain backprojected component activations displayed in Fig. 11. Row 1 corresponds to the most centrally located voxels, row 6 to the posterior ones. Right: Corresponding average time-courses computed from the recorded activations in the 0.1 Hz band of the same voxels. For the average IC activation (left), the voxel-rows are activated in the order 1 – (2, 3) – (4, 5, 6) with row 6 being activated with a time lag of about 1 s with respect to row 1. This lag is compatible with blood supply propagating across the patch in the posterior direction. In the average recorded activations (right), the voxel-rows are activated in the order 1 – 2 – 4 – (5, 6) – 3. With the exception of row 3, this also indicates a posterior direction of propagation. The most posterior voxel-row of backprojected component IC2 shows strongest activation which is plausible since it is closest to the drainage vein. The same tendency is found in the recorded signals, but ordering of amplitude of voxel-rows is not as monotonous as for IC2. Backprojected IC activations may represent a cleaner picture of the stimulus related process with respect to phase- and amplitude-gradient, because activity of other ongoing brain processes is canceled out.
Comparison with results from standard time-domain ICA. ROA of component IC8 obtained with real-valued infomax ICA, superimposed on the structural image and ROA interpolated to the higher resolution of the structural scan. Similar to the components from complex ICA, this component extends over visual area V1 and blood supply vessels. The large overlap between the real-valued component and the complex-valued components shown in Figs. 3 to 9 shows that they model the same physiological (visual) process, although the real-valued component cannot take into account the spatio-temporal dynamics reflected in the complex ICs.
Complex ICA component reflecting cerebro-spinal-fluid (CSF) activity in ventral areas. Magnitude map of the component ROA for complex component IC1 in the 0.05 Hz band, superimposed on structural image and interpolated to its higher resolution.
Similar articles
-
Complex independent component analysis of frequency-domain electroencephalographic data.Neural Netw. 2003 Nov;16(9):1311-23. doi: 10.1016/j.neunet.2003.08.003. Neural Netw. 2003. PMID: 14622887 Free PMC article.
-
Gaussian process based independent analysis for temporal source separation in fMRI.Neuroimage. 2017 May 15;152:563-574. doi: 10.1016/j.neuroimage.2017.02.070. Epub 2017 Feb 27. Neuroimage. 2017. PMID: 28249758
-
Analysis of fMRI data by blind separation of data in a tiny spatial domain into independent temporal component.Brain Topogr. 2003 Summer;15(4):223-32. doi: 10.1023/a:1023958024689. Brain Topogr. 2003. PMID: 12866826
-
Spatial and temporal independent component analysis of functional MRI data containing a pair of task-related waveforms.Hum Brain Mapp. 2001 May;13(1):43-53. doi: 10.1002/hbm.1024. Hum Brain Mapp. 2001. PMID: 11284046 Free PMC article.
-
In Vivo Observations of Rapid Scattered Light Changes Associated with Neurophysiological Activity.In: Frostig RD, editor. In Vivo Optical Imaging of Brain Function. 2nd edition. Boca Raton (FL): CRC Press/Taylor & Francis; 2009. Chapter 5. In: Frostig RD, editor. In Vivo Optical Imaging of Brain Function. 2nd edition. Boca Raton (FL): CRC Press/Taylor & Francis; 2009. Chapter 5. PMID: 26844322 Free Books & Documents. Review.
Cited by
-
Utility of independent component analysis for interpretation of intracranial EEG.Front Hum Neurosci. 2010 Nov 2;4:184. doi: 10.3389/fnhum.2010.00184. eCollection 2010. Front Hum Neurosci. 2010. PMID: 21152349 Free PMC article.
-
Reactivity of hemodynamic responses and functional connectivity to different states of alpha synchrony: a concurrent EEG-fMRI study.Neuroimage. 2010 Oct 1;52(4):1252-60. doi: 10.1016/j.neuroimage.2010.05.053. Epub 2010 May 25. Neuroimage. 2010. PMID: 20510374 Free PMC article.
-
Propagations of spontaneous brain activity in awake rats.Neuroimage. 2019 Nov 15;202:116176. doi: 10.1016/j.neuroimage.2019.116176. Epub 2019 Sep 9. Neuroimage. 2019. PMID: 31513942 Free PMC article.
-
Temporal dynamics of perisylvian activation during language processing in children and adults.Neuroimage. 2008 Jul 15;41(4):1484-92. doi: 10.1016/j.neuroimage.2008.03.027. Epub 2008 Mar 28. Neuroimage. 2008. PMID: 18479941 Free PMC article.
-
Independent component analysis applied to the removal of motion artifacts from electrocardiographic signals.Med Biol Eng Comput. 2008 Mar;46(3):251-61. doi: 10.1007/s11517-007-0293-8. Epub 2007 Dec 7. Med Biol Eng Comput. 2008. PMID: 18064502
References
-
- Amari S, Cichocki A, Yang HH. A new learning algorithm for blind signal separation. In: Touretzky D, Mozer M, Hasselmo M, editors. Advances in Neural Information Processing Systems. Vol. 8. MIT Press; Cambridge, MA: 1996. pp. 757–763.
-
- Anemüller J. PhD Thesis. Department of Physics, University of Oldenburg; Oldenburg, Germany: 2001. Across-frequency processing in convolutive blind source separation.
-
- Anemüller J, Gramß T. On-line blind separation of moving sound sources. In: Cardoso JF, Jutten Ch, Loubaton Ph, editors. Proceedings of the First International Workshop on Independent Component Analysis and Blind Signal Separation. Aussois, France: 1999. pp. 331–334.
-
- Anemüller J, Kollmeier B. Adaptive separation of acoustic sources for anechoic conditions: a constrained frequency domain approach. Speech Commun. 2003;39(1–2):79–95.
Grants and funding
LinkOut - more resources
Full Text Sources
Miscellaneous