. 2010 Aug;12(8):637-49.
doi: 10.1593/neo.10414.

Pharmacodynamic characterization of the efficacy signals due to selective BRAF inhibition with PLX4032 in malignant melanoma

Affiliations

Pharmacodynamic characterization of the efficacy signals due to selective BRAF inhibition with PLX4032 in malignant melanoma

William D Tap et al. Neoplasia. 2010 Aug.

Abstract

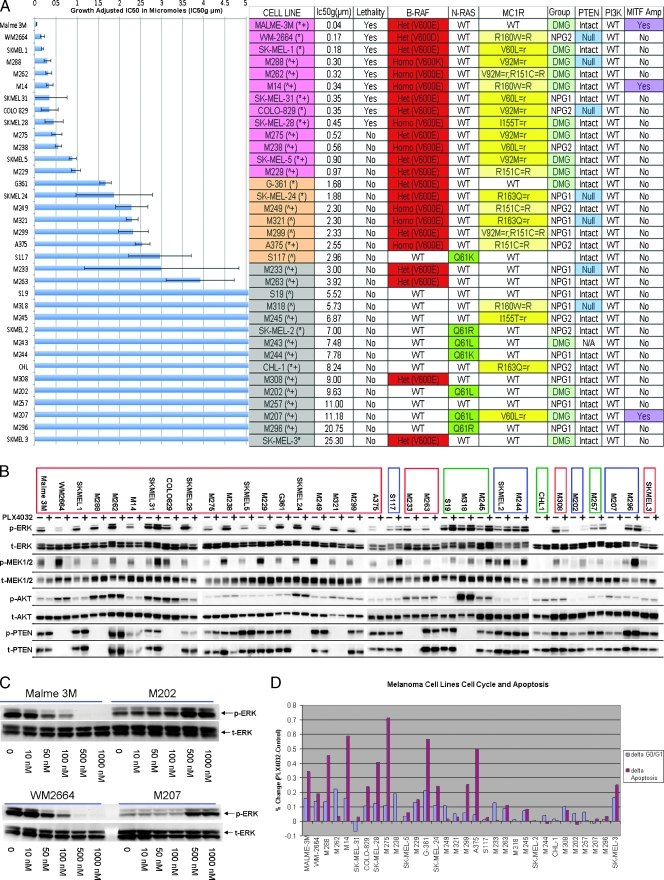
Purpose: About 65% to 70% of melanomas harbor a mutation in v-raf murine sarcoma viral oncogene homolog B1 (BRAF) that causes the steady-state activation of extracellular signal-regulated kinase (ERK). We sought to investigate the efficacy of PLX4032 (BRAF inhibitor) to identify patterns/predictors of response/resistance and to study the effects of BRAF in melanoma.

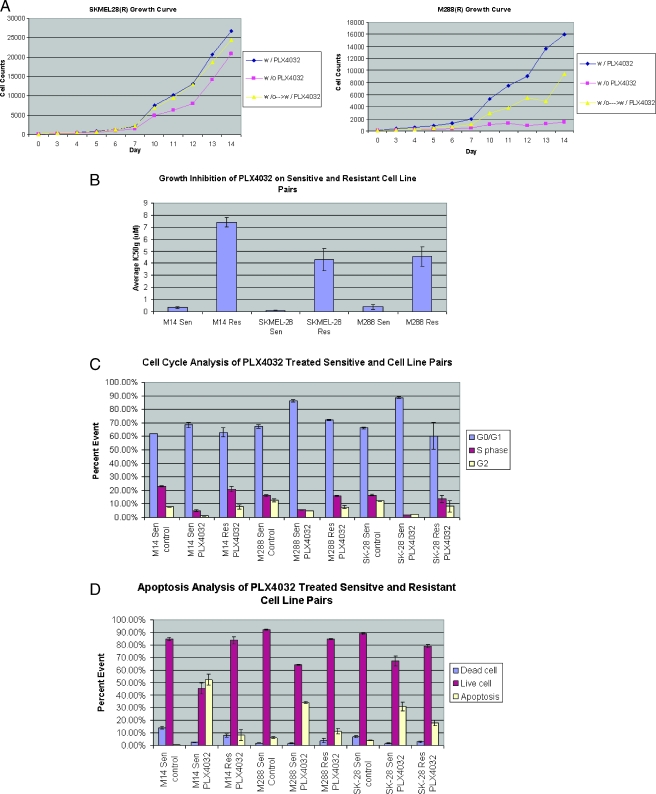
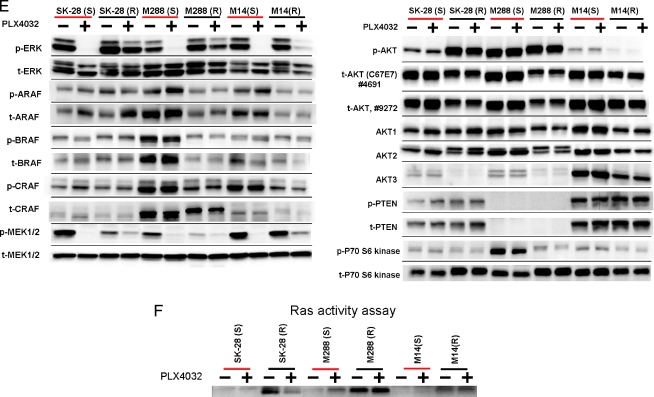
Experimental design: Well-characterized melanoma cell lines, including several with acquired drug resistance, were exposed to PLX4032. Growth inhibition, phosphosignaling, cell cycle, apoptosis, and gene expression analyses were performed before and after exposure to drug.

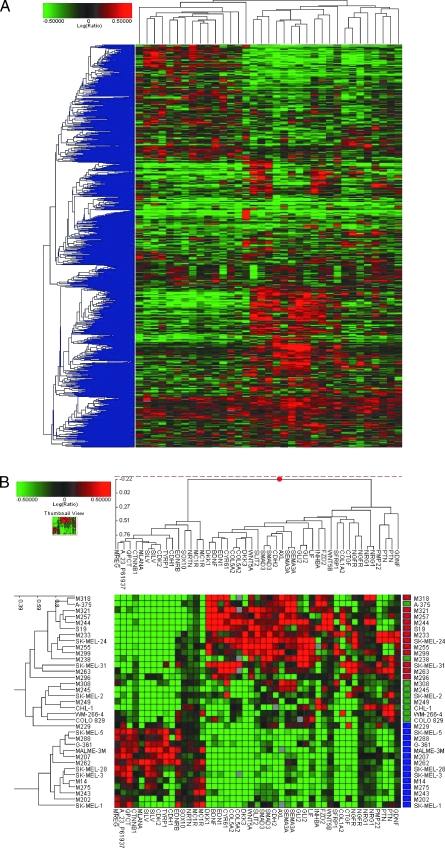
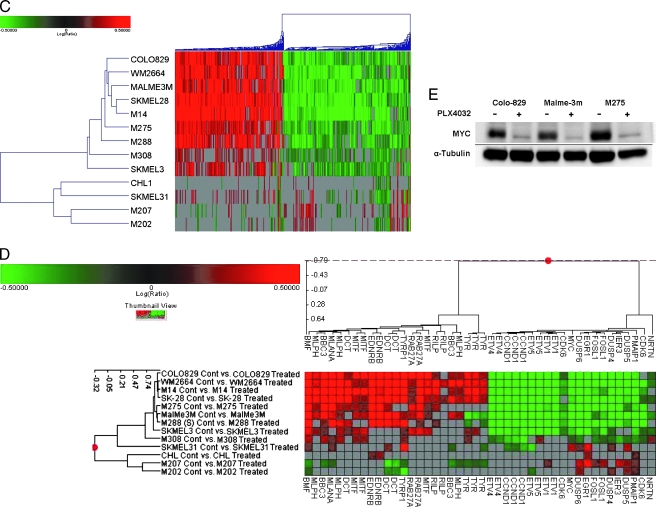
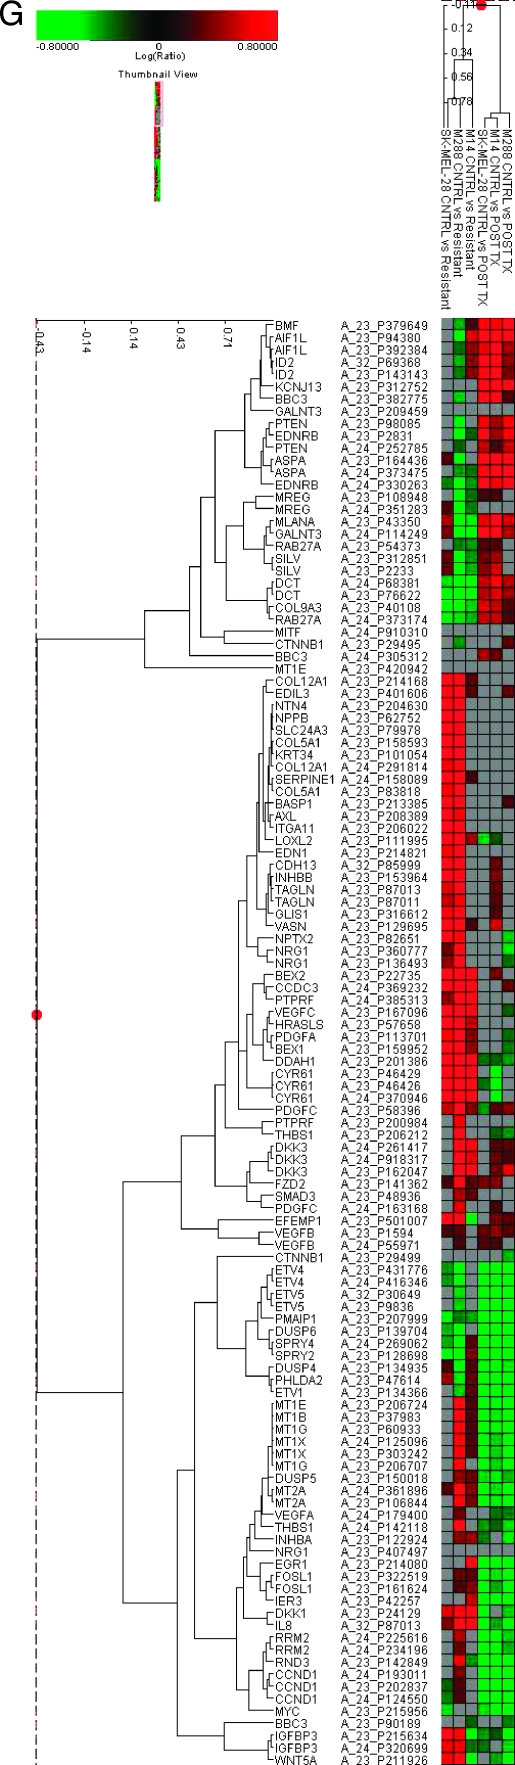
Results: Using a growth-adjusted inhibitory concentration of 50% cutoff of 1 microM, 13 of 35 cell lines were sensitive to PLX4032, 16 resistant, and 6 intermediate (37%, 46%, and 17% respectively). PLX4032 caused growth inhibition, G(0)/G(1) arrest, and restored apoptosis in the sensitive cell lines. A BRAF mutation predicted for but did not guarantee a response, whereas a neuroblastoma RAS viral oncogene homolog mutation or wild-type BRAF conferred resistance. Cells with concurrent BRAF mutations and melanocortin 1 receptor germ line variants and/or a more differentiated melanocyte genotype had a preferential response. Acquired PLX4032 resistance reestablishes ERK signaling, promotes a nonmelanocytic genotype, and is associated with an increase in the gene expression of certain metallothioneins and mediators of angiogenesis.

Conclusions: PLX4032 has robust activity in BRAF mutated melanoma. The preclinical use of this molecule identifies criteria for its proper clinical application, describes patterns of and reasons for response/resistance, and affords insight into the role of a BRAF mutation in melanoma.


Figures

Figure 1
Figure 1
Functional activity of PLX4032. (A) Growth inhibition assay of MM cell lines (n = 35) after exposure to PLX4032. The concentration of drug in micromolars that achieves a growth adjusted inhibitory concentration of 50% (IC50g µM) (x-axis), melanoma cell line (y-axis). SE is depicted. Table outlines characteristics of the 35 MM cell lines. Order of cell lines corresponds to the growth inhibition chart. Cell lines are color coordinated based on response (pink—clear sensitivity, orange—intermediate sensitivity, gray—resistant). In parenthesis next to the cell line: *cells were purchased from ATCC or ^developed from tumor samples at UCLA (University California, Los Angeles), +cell lines that were included in the complementary RNA mixed reference pool for the microarray analysis. Lethality = cell death in addition to growth inhibition. BRAF and NRAS status with specific amino acid substitutions; MC1R germ line status/gene polymorphism; R versus r describes the functional effect of MC1R variant/relation to skin pigmentation [3]. Gene expression groupings: DMG = differentiated melanocyte group, NPG = neuronal precursor group. PTEN and PI3K status: presence of MITF amplification as determined by focal in situ hybridization (>2 genes per chromosome 3 centromeres). (B) Phosphoprotein signaling of MM cell lines through Western blot analysis before and after exposure to PLX4032. Cell lines are listed in order of sensitivity. Composite arrangement of multiple Western blots is depicted by dividing lines. BRAFm cell lines are outlined in a red box; NRASm, blue; and BRAFwt/NRASwt, green. (C) Western blot analysis of two BRAFm (Malme3M and WM2664) and two NRASm (M202 and M207) MM cell lines after exposure to increasing concentrations of PLX4032. (D) Cell cycle and apoptosis assays as done by flow cytometry. Chart depicts percent change in the number of cells in G0/1 (blue bar) and the number of cells in apoptosis (maroon bar) of the treated cell line versus the untreated control.
Figure 2
Figure 2
Gene expression analysis of the 35 MM cell lines. (A) Global view of unsupervised two-dimensional clustering of the 35 cell lines using a statistical cutoff for genes with a two-fold change in at least four experiments (3997 resulting genes). Cell lines (top), individual genes (left). Red increased expression; green, decreased expression. Color intensity correlates with degree of expression compared with the complementary RNA mixed reference pool. (B) Supervised clustering: differential gene expression patterns of melanoma cell lines generated by an ANOVA. Two-dimensional clustering of 35 melanoma cell lines based on the expression pattern of selective genes associated with MITF (A_23_P61937) and its downstream signaling pathway, melanocyte function, melanin synthesis, noncanonical Wnt and Tgfβ pathways, and neuronal mediators of NCC development. Length of dendogram arm depicts degree of association of the cell lines based on the expression pattern of these 37 genes. MM subgroups are represented by color blocks on the right of the cluster diagram (blue—group A [DMG], red—group B1 [NPG1], green—group B2 [NPG2]). (C) Global clustering of eight sensitive and five resistant cell lines after their exposure to PLX4032. Expression signatures depict the fold change of the posttreatment versus pretreatment samples. A statistical cutoff for genes with at least a two-fold change in at least four experiments was performed, resulting in 1927 genes that had a P < .01. (D) Two-dimensional clustering that displays the expression patterns of genes associated with aberrant ERK signaling and melanocyte differentiation and function. Each row displays the difference in the expression of genes in the post treatment line compared with the pretreatment line. (E) Western blot analysis of C-MYC expression in selected cell lines before and after exposure to PLX4032.
Figure 2
Figure 2
Gene expression analysis of the 35 MM cell lines. (A) Global view of unsupervised two-dimensional clustering of the 35 cell lines using a statistical cutoff for genes with a two-fold change in at least four experiments (3997 resulting genes). Cell lines (top), individual genes (left). Red increased expression; green, decreased expression. Color intensity correlates with degree of expression compared with the complementary RNA mixed reference pool. (B) Supervised clustering: differential gene expression patterns of melanoma cell lines generated by an ANOVA. Two-dimensional clustering of 35 melanoma cell lines based on the expression pattern of selective genes associated with MITF (A_23_P61937) and its downstream signaling pathway, melanocyte function, melanin synthesis, noncanonical Wnt and Tgfβ pathways, and neuronal mediators of NCC development. Length of dendogram arm depicts degree of association of the cell lines based on the expression pattern of these 37 genes. MM subgroups are represented by color blocks on the right of the cluster diagram (blue—group A [DMG], red—group B1 [NPG1], green—group B2 [NPG2]). (C) Global clustering of eight sensitive and five resistant cell lines after their exposure to PLX4032. Expression signatures depict the fold change of the posttreatment versus pretreatment samples. A statistical cutoff for genes with at least a two-fold change in at least four experiments was performed, resulting in 1927 genes that had a P < .01. (D) Two-dimensional clustering that displays the expression patterns of genes associated with aberrant ERK signaling and melanocyte differentiation and function. Each row displays the difference in the expression of genes in the post treatment line compared with the pretreatment line. (E) Western blot analysis of C-MYC expression in selected cell lines before and after exposure to PLX4032.
Figure 3
Figure 3
Analysis of resistant cell lines (M288R, SK-MEL-28R, and M14R) compared with their sensitive parental counterparts (M288, SK-MEL-28, and M14). (A) Growth curves of SKMEL28R and M288R. Blue lines—cells grown in the continued presence of PLX4032, pink—absence of PLX4032, yellow—grown in the absence and then the presence of PLX4032; y-axis—cell count, x-axis—day of count. (B) Growth inhibition assay (IC50g µM) in the presence of PLX4032. (C) Cell cycle and (D) apoptosis assays as done by flow cytometry. (E) Phosphoprotein signaling of MM cell lines before and after exposure to PLX4032. Two separate total AKT antibodies that recognize different epitopes were used. (F) RAS activation assay in sensitive and resistant counterparts before and after exposure to PLX4032. (G) A comparative gene expression analysis of the expression profiles of M288R, SKMEL28R, and M14R and M14, M288, and SKMEL28. Selected genes are listed. Columns depict fold change in the gene expression of M288R, SKMEL28R, and M14R compared with M14, M288, and SKMEL28 and the fold change in the gene expression in the post PLX4032 treatment samples of M14, SKMEL28, and M288 compared with pretreatment controls.
Figure 3
Figure 3
Analysis of resistant cell lines (M288R, SK-MEL-28R, and M14R) compared with their sensitive parental counterparts (M288, SK-MEL-28, and M14). (A) Growth curves of SKMEL28R and M288R. Blue lines—cells grown in the continued presence of PLX4032, pink—absence of PLX4032, yellow—grown in the absence and then the presence of PLX4032; y-axis—cell count, x-axis—day of count. (B) Growth inhibition assay (IC50g µM) in the presence of PLX4032. (C) Cell cycle and (D) apoptosis assays as done by flow cytometry. (E) Phosphoprotein signaling of MM cell lines before and after exposure to PLX4032. Two separate total AKT antibodies that recognize different epitopes were used. (F) RAS activation assay in sensitive and resistant counterparts before and after exposure to PLX4032. (G) A comparative gene expression analysis of the expression profiles of M288R, SKMEL28R, and M14R and M14, M288, and SKMEL28. Selected genes are listed. Columns depict fold change in the gene expression of M288R, SKMEL28R, and M14R compared with M14, M288, and SKMEL28 and the fold change in the gene expression in the post PLX4032 treatment samples of M14, SKMEL28, and M288 compared with pretreatment controls.

Similar articles

Cited by

References

    1. Curtin JA, Fridlyand J, Kageshita T, Patel HN, Busam KJ, Kutzner H, Cho KH, Aiba S, Brocker EB, LeBoit PE, et al. Distinct sets of genetic alterations in melanoma. N Engl J Med. 2005;353:2135–2147. - PubMed
    1. Curtin JA, Busam K, Pinkel D, Bastian BC. Somatic activation of KIT in distinct subtypes of melanoma. J Clin Oncol. 2006;24:4340–4346. - PubMed
    1. Landi MT, Bauer J, Pfeiffer RM, Elder DE, Hulley B, Minghetti P, Calista D, Kanetsky PA, Pinkel D, Bastian BC. MC1R germline variants confer risk for BRAF-mutant melanoma. Science. 2006;313:521–522. - PubMed
    1. Kim KB, Eton O, Davis DW, Frazier ML, McConkey DJ, Diwan AH, Papadopoulos NE, Bedikian AY, Camacho LH, Ross MI, et al. Phase II trial of imatinib mesylate in patients with metastatic melanoma. Br J Cancer. 2008;99:734–740. - PMC - PubMed
    1. Amaravadi RK, Schuchter LM, McDermott DF, Kramer A, Giles L, Gramlich K, Carberry M, Troxel AB, Letrero R, Nathanson KL, et al. Phase II trial of temozolomide and sorafenib in advanced melanoma patients with or without brain metastases. Clin Cancer Res. 2009;15:7711–7718. - PMC - PubMed

Publication types

MeSH terms