

Anti-Angiogenic/Vascular Effects of the mTOR Inhibitor Everolimus Are Not Detectable by FDG/FLT-PET
- PMID: 20689768
- PMCID: PMC2915418
- DOI: 10.1593/tlo.10127
Anti-Angiogenic/Vascular Effects of the mTOR Inhibitor Everolimus Are Not Detectable by FDG/FLT-PET
Abstract
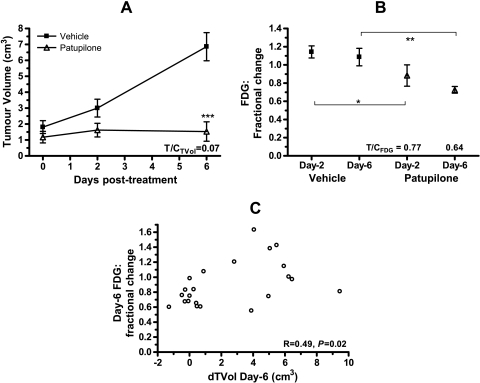
Noninvasive functional imaging of tumors can provide valuable early-response biomarkers, in particular, for targeted chemotherapy. Using various experimental tumor models, we have investigated the ability of positron emission tomography (PET) measurements of 2-deoxy-2-[(18)F]fluoro-glucose (FDG) and 3'-deoxy-3'-[(18)F]fluorothymidine (FLT) to detect response to the allosteric mammalian target of rapamycin (mTOR) inhibitor everolimus. Tumor models were declared sensitive (murine melanoma B16/BL6 and human lung H596) or relatively insensitive (human colon HCT116 and cervical KB31), according to the IC(50) values (concentration inhibiting cell growth by 50%) for inhibition of proliferation in vitro (<10 nM and >1 microM, respectively). Everolimus strongly inhibited growth of the sensitive models in vivo but also significantly inhibited growth of the insensitive models, an effect attributable to its known anti-angiogenic/vascular properties. However, although tumor FDG and FLT uptake was significantly reduced in the sensitive models, it was not affected in the insensitive models, suggesting that endothelial-directed effects could not be detected by these PET tracers. Consistent with this hypothesis, in a well-vascularized orthotopic rat mammary tumor model, other antiangiogenic agents also failed to affect FDG uptake, despite inhibiting tumor growth. In contrast, the cytotoxic patupilone, a microtubule stabilizer, blocked tumor growth, and markedly reduced FDG uptake. These results suggest that FDG/FLT-PET may not be a suitable method for early markers of response to antiangiogenic agents and mTOR inhibitors in which anti-angiogenic/vascular effects predominate because the method could provide false-negative responses. These conclusions warrant clinical testing.
Figures


Similar articles
-
18F-FLT PET as a surrogate marker of drug efficacy during mTOR inhibition by everolimus in a preclinical cisplatin-resistant ovarian tumor model.J Nucl Med. 2010 Oct;51(10):1559-64. doi: 10.2967/jnumed.109.073288. Epub 2010 Sep 16. J Nucl Med. 2010. PMID: 20847160
-
Monitoring of anti-cancer treatment with (18)F-FDG and (18)F-FLT PET: a comprehensive review of pre-clinical studies.Am J Nucl Med Mol Imaging. 2015 Oct 12;5(5):431-56. eCollection 2015. Am J Nucl Med Mol Imaging. 2015. PMID: 26550536 Free PMC article. Review.
-
[Correlation of 3'-deoxy-3'-18F-fluorothymidine uptake to cell proliferation in lung carcinoma xenografts].Ai Zheng. 2006 Dec;25(12):1512-6. Ai Zheng. 2006. PMID: 17166377 Chinese.
-
FLT-PET is superior to FDG-PET for very early response prediction in NPM-ALK-positive lymphoma treated with targeted therapy.Cancer Res. 2012 Oct 1;72(19):5014-24. doi: 10.1158/0008-5472.CAN-12-0635. Epub 2012 Aug 8. Cancer Res. 2012. PMID: 22875026
-
FLT: measuring tumor cell proliferation in vivo with positron emission tomography and 3'-deoxy-3'-[18F]fluorothymidine.Semin Nucl Med. 2007 Nov;37(6):429-39. doi: 10.1053/j.semnuclmed.2007.08.001. Semin Nucl Med. 2007. PMID: 17920350 Review.
Cited by
-
Targeting the de novo biosynthesis of thymidylate for the development of a PET probe for pancreatic cancer imaging.Biochemistry. 2015 Feb 10;54(5):1287-93. doi: 10.1021/bi501481n. Epub 2015 Jan 27. Biochemistry. 2015. PMID: 25581782 Free PMC article.
-
Early Changes in [18F]FDG Uptake as a Readout for PI3K/Akt/mTOR Targeted Drugs in HER-2-Positive Cancer Xenografts.Mol Imaging. 2021 May 25;2021:5594514. doi: 10.1155/2021/5594514. eCollection 2021. Mol Imaging. 2021. PMID: 34113218 Free PMC article.
-
Tyrosine Kinase Inhibitors Reduce Glucose Uptake by Binding to an Exofacial Site on hGLUT-1: Influence on 18 F-FDG PET Uptake.Clin Transl Sci. 2021 May;14(3):847-858. doi: 10.1111/cts.12943. Epub 2021 May 3. Clin Transl Sci. 2021. PMID: 33278334 Free PMC article.
-
Utility of 3'-[(18)F]fluoro-3'-deoxythymidine as a PET tracer to monitor response to gene therapy in a xenograft model of head and neck carcinoma.Am J Nucl Med Mol Imaging. 2013;3(1):16-31. Epub 2013 Jan 5. Am J Nucl Med Mol Imaging. 2013. PMID: 23342298 Free PMC article.
-
Detection of rapalog-mediated therapeutic response in renal cancer xenografts using ⁶⁴Cu-bevacizumab immunoPET.PLoS One. 2013;8(3):e58949. doi: 10.1371/journal.pone.0058949. Epub 2013 Mar 14. PLoS One. 2013. PMID: 23516584 Free PMC article.
References
-
- Bjornsti M-A, Houghton PJ. The TOR pathway: a target for cancer chemotherapy. Nat Rev Cancer. 2004;4:335–348. - PubMed
-
- Lane HA, Wood JM, McSheehy PM, Allegrini PR, Boulay A, Brueggen J, Littlewood-Evans A, Maira SM, Martiny-Baron G, Schnell CR, et al. The mTOR inhibitor RAD001 (everolimus) has anti-angiogenic/vascular properties distinct from a VEGF-R tyrosine kinase inhibitor. Clin Cancer Res. 2009;15:1612–1622. - PubMed
-
- Motzer RJ, Escudier B, Oudard S, Hutson TE, Porta C, Bracarda S, Grünwald V, Thompson JA, Figlin RA, Hollaender N, et al. Efficacy of everolimus in advanced renal cell carcinoma: a double-blind, randomised, placebo-controlled phase III trial. Lancet. 2008;372:449–456. - PubMed
-
- Korhonen P, Malangone E, Sherman S, Casciano R, Motzer R, Baladi JF, Haas T, Zuber E, Kay A, Lebwohl D. Overall survival (OS) of mRCC patients corrected for crossover using inverse probability of censoring weights (IPCW) and rank preserving structural failure time (RPSFT) models: two analyses from the RECORD-1 trial; Paper presented at: Annual Meeting of the American Society of Clinical Oncology; June 4–8, 2010; Chicago, IL. Abstract 4690.
LinkOut - more resources
Full Text Sources
Miscellaneous
