. 2010 Aug 1;3(4):276-85.
doi: 10.1593/tlo.10106.

A Polymorphic Variant of AFAP-110 Enhances cSrc Activity

Affiliations

A Polymorphic Variant of AFAP-110 Enhances cSrc Activity

David A Clump et al. Transl Oncol. .

Abstract

Enhanced expression and activity of cSrc are associated with ovarian cancer progression. Generally, cSrc does not contain activating mutations; rather, its activity is increased in response to signals that affect a conformational change that releases its autoinhibition. In this report, we analyzed ovarian cancer tissues for the expression of a cSrc-activating protein, AFAP-110. AFAP-110 activates cSrc through a direct interaction that releases it from its autoinhibited conformation. Immunohistochemical analysis revealed a concomitant increase of AFAP-110 and cSrc in ovarian cancer tissues. An analysis of the AFAP-110 coding sequence revealed the presence of a nonsynonymous, single-nucleotide polymorphism that resulted in a change of Ser403 to Cys403. In cells that express enhanced levels of cSrc, AFAP-110(403C) directed the activation of cSrc and the formation of podosomes independently of input signals, in contrast to wild-type AFAP-110. We therefore propose that, under conditions of cSrc overexpression, the polymorphic variant of AFAP-110 promotes cSrc activation. Further, these data indicate amechanismby which an inherited genetic variation could influence ovarian cancer progression and could be used to predict the response to targeted therapy.


Figures

Figure 1
Figure 1
Focal and diffuse expression patterns of AFAP-110 and cSrc. Ovarian cancer tissues were sectioned and IHC performed with anti-AFAP-110 (pAb F1) or anti-cSrc antibody (monoclonal antibody EG107) and the intensity of immunolabeling (brown) qualitatively assessed by a pathologist. Samples that show focal (highly localized) or diffuse immunolabeling that exhibit deep, robust, or weak immunostaining are shown for comparison, and these types of images represent the assessment of tissue immunostaining shown in Table W1. (A) AFAP-110 expressed strongly in focal areas of the tumor. (B) AFAP-110 expressed weakly in focal areas of the tumor. (C) cSrc expressed strongly and diffusely throughout the tumor. (D) cSrc expressed weakly and diffusely throughout the tumor.
Figure 2
Figure 2
Coexpression of AFAP-110 and cSrc in ovarian tumors. Serial sections of normal human ovary tissues, well-differentiated, and undifferentiated human ovary tissues were immunolabeled for AFAP-110 with pAb F1, cSrc antibody EG107, and hematoxylin and eosin (H&E) staining as described under Materials and Methods: normal ovary/AFAP-110 (A), normal ovary/cSrc (B), normal ovary/H&E (C), well-differentiated tumor/AFAP-110 (D), well-differentiated tumor/cSrc (E), well-differentiated tumor/H&E (F), ovarian tumor/AFAP-110 (G), ovarian tumor/cSrc (H), ovarian tumor/H&E (I), undifferentiated tumor/AFAP-110 (J), undifferentiated tumor/cSrc (K), and undifferentiated tumor/H&E (L). In comparison to normal human ovaries (A–C), AFAP-110 and cSrc protein are overexpressed and colocalized in well-differentiated tumors (D–F), as well as desmoplastic regions of human ovarian tumors (G–I). AFAP-110 is overexpressed in undifferentiated tissue specimens (J–L); however, colocalization with cSrc was variable. All images were captured at a magnification of 100x. As stated in Table W1, 33 ovarian tumors were analyzed. Of these, 20 were differentiated tumors and 13 were undifferentiated. Six normal ovaries were analyzed.
Figure 3
Figure 3
cSrc expression level in ovarian tumorsmatch those levels detected in SYF-cSrc cells. (A) Fifty micrograms of SYF or SYF-cSrc cellular lysates or human ovarian tissue lysates was resolved by 8% SDS-PAGE and transferred to PVDF, and Western blot analysis was performed with anti-cSrc antibodies. Code numbers for deidentified patient samples are shown. Five samples had Ser403 encoded on at least one allele, and five samples had Cys403 encoded on at least one allele. (B) cSrc and AFAP-110 expression levels are increased in ovarian tumors relative to normal, adjacent tissue. Western blot analysis with antibodies to AFAP-110 or cSrc of two ovarian tumor samples (T) and matching, adjacent control tissues (N) from two patient samples (nos. 77 and 82). Patient no. 77 has the AFAP-110 Ser403 wild-type isoform, whereas patient no. 82 has the AFAP-110 Cys403 SNP on at least one allele.
Figure 4
Figure 4
Molecular modeling of the PH2 domain. Homology models for AFAP-110 PH2-WT (A and B) and AFAP-110 PH2403C (C and D) demonstrated that the amino acid change occurs in a loop region between the fifth and sixth β-strand. Performing a hydrogen bond (dashed black lines) analysis for each structure predicted that AFAP-110 PH2-WT binds to water molecules (solid red lines) 71% of the time, potentially forming a rigid binding region. In contrast, AFAP-110 PH2403C was predicted to bind to water only 36% of the time. Labeled amino acids occur at coordinates predicted to interact with phospholipid head groups. Intrastrand loops: green; β-strands: blue; α-helix: red.
Figure 5
Figure 5
Affinity precipitation of AFAP-110 with GST-PH2 and GST-PH2403C. GST affinity precipitation experiment comparing the differential ability of GST-PH2 and GST-PH2403C to bind AFAP-110 in MEF, SYF, SYF-cSrc, and CaOV3 cell lysates (A). Equal quantities of GST fusion proteins were used to affinity precipitate AFAP-110 from equal amounts of cell lysates. (A) Western blot analysis with pAb F1 indicate that GST-PH2 is more efficient in binding AFAP-110 then GST-PH2403C. CaOV3 cells serve as the negative control in these experiments because this cell line has low to undetectable amount of AFAP-110. Western blots of cell lysates for AFAP-110 (B) and actin loading controls (C) are also shown.
Figure 6
Figure 6
cSrc activity in SYF cells expressing cSrc and AFAP-110403C. (A) Flag-tagged AFAP-110 or AFAP-110403C was transfected into SYF-cSrc cells, and expression levels were detected with anti-Flag antibodies. cSrc expression levels and immunoreactivity with anti-pSrc416 antibodies were determined. (B) Fifty micrograms of MEF, SYF, or SYF-cSrc cellular lysates was resolved by 8% SDS-PAGE and transferred to PVDF, and cSrc was detected with anti-cSrc antibodies.
Figure 7
Figure 7
cSrc activation and podosome formation in SYF-cSrc cells expressing AFAP-110403C. (A) MEF cells were transfected with GFP-AFAP-110 or GFP-AFAP-110403C and analyzed for activation of endogenous cSrc or changes in actin filament integrity and podosome formation. Bars, 20 µm. (B) SFY-cSrc cells similarly transiently transfected with GFP-AFAP-110 or GFP-AFAP-110403C and immunolabeled with anti-Src antibody (b and f) and phospho-Src family (Y416) antibody (c and g). Unlike wild-type GFP-AFAP-110, expression of GFP-AFAP-110403C resulted in the formation of punctate structures on the ventral surface of the cells enriched for GFP-AFAP-110403C (e) that exhibited an increase in c-Src phosphorylation at the Y416 position (merged image, h). (C) Punctate structures resulting from the expression of GFP-AFAP-110403C were also enriched for actin and cortactin (merged image, q). In contrast, cells expressing wild-type GFP-AFAP-110-maintained actin filaments and did not exhibit the formation of actin-rich podosomes (j–m). Bars, 10 µm (panels a–d, e–h, n–q) and 20 µm (panels j–m).
Figure 8
Figure 8
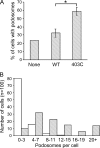
AFAP-110403C directed podosome formation in SYF-cSrc cells. (A) Podosomes were counted in the transfected cells, and the percentage of cells expressing podosomes was quantified (*P = .015, n = 500 cells). (B) The number of podosomes per cell was quantified. Thepodosome distributionwas determined by comparing AFAP-110 to AFAP-110403C. Whereas 80% of the cells transfected with AFAP-110 wild type (empty bars) exhibit between 0 and three podosomes/cell, cells transfected with AFAP-110403C (hatched bars) exhibit a broad distribution with greater than 50% exhibiting more than eight podosomes per cell.

Similar articles

Cited by

References

    1. Naora H, Montell DJ. Ovarian cancer metastasis: integrating insights from disparate model organisms. Nat Rev Cancer. 2005;5:355–366. - PubMed
    1. Jemal A, Siegel R, Ward E, Murray T, Xu J, Thun MJ. Cancer statistics, 2007. CA Cancer J Clin. 2007;57:43–66. - PubMed
    1. Pal T, Permuth-Wey J, Betts JA, Krischer JP, Fiorica J, Arango H, LaPolla J, Hoffman M, Martino MA, Wakeley K, et al. BRCA1 and BRCA2 mutations account for a large proportion of ovarian carcinoma cases. Cancer. 2005;104:2807–2816. - PubMed
    1. Risch HA, McLaughlin JR, Cole DE, Rosen B, Bradley L, Fan I, Tang J, Li S, Zhang S, Shaw PA, et al. Population BRCA1 and BRCA2 mutation frequencies and cancer penetrances: a kin-cohort study in Ontario, Canada. J Natl Cancer Inst. 2006;98:1694–1706. - PubMed
    1. Goldstein DB, Cavalleri GL. Genomics: understanding human diversity. Nature. 2005;437:1241–1242. - PubMed

LinkOut - more resources