

Antarctic marine biodiversity--what do we know about the distribution of life in the Southern Ocean?
- PMID: 20689841
- PMCID: PMC2914006
- DOI: 10.1371/journal.pone.0011683
Antarctic marine biodiversity--what do we know about the distribution of life in the Southern Ocean?
Abstract
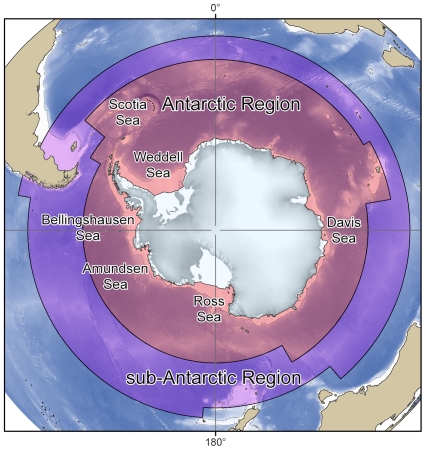
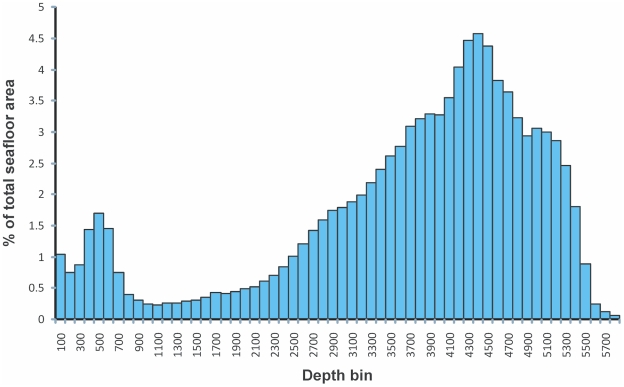
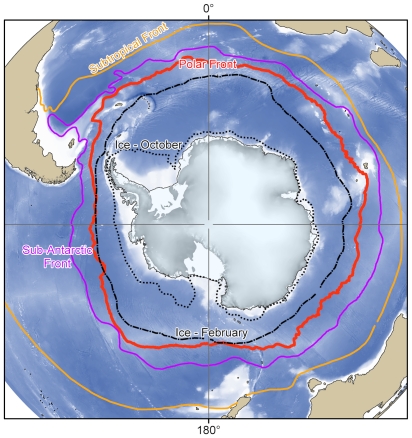
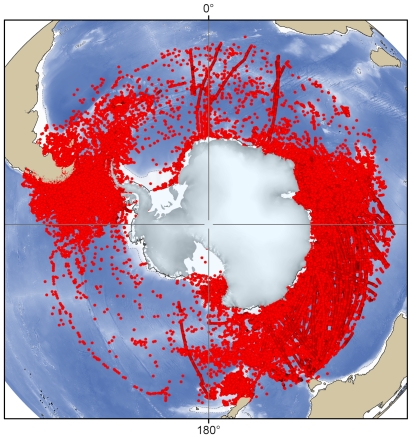
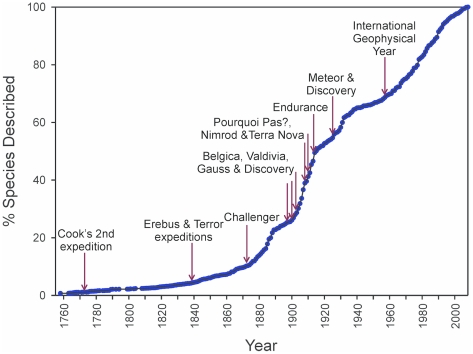
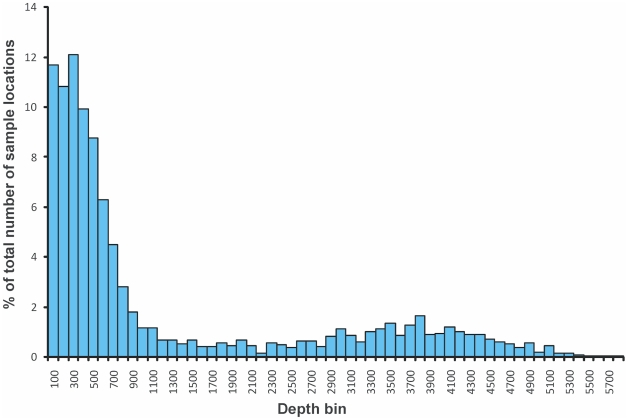
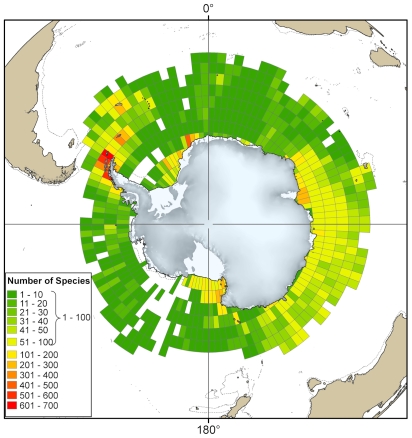
The remote and hostile Southern Ocean is home to a diverse and rich community of life that thrives in an environment dominated by glaciations and strong currents. Marine biological studies in the region date back to the nineteenth century, but despite this long history of research, relatively little is known about the complex interactions between the highly seasonal physical environment and the species that inhabit the Southern Ocean. Oceanographically, the Southern Ocean is a major driver of global ocean circulation and plays a vital role in interacting with the deep water circulation in each of the Pacific, Atlantic, and Indian oceans. The Census of Antarctic Marine Life and the Scientific Committee on Antarctic Research Marine Biodiversity Information Network (SCAR-MarBIN) have strived to coordinate and unify the available scientific expertise and biodiversity data to improve our understanding of Southern Ocean biodiversity. Taxonomic lists for all marine species have been compiled to form the Register of Antarctic Marine Species, which currently includes over 8,200 species. SCAR-MarBIN has brought together over 1 million distribution records for Southern Ocean species, forming a baseline against which future change can be judged. The sample locations and numbers of known species from different regions were mapped and the depth distributions of benthic samples plotted. Our knowledge of the biodiversity of the Southern Ocean is largely determined by the relative inaccessibility of the region. Benthic sampling is largely restricted to the shelf; little is known about the fauna of the deep sea. The location of scientific bases heavily influences the distribution pattern of sample and observation data, and the logistical supply routes are the focus of much of the at-sea and pelagic work. Taxa such as mollusks and echinoderms are well represented within existing datasets with high numbers of georeferenced records. Other taxa, including the species-rich nematodes, are represented by just a handful of digital records.
Conflict of interest statement
Figures
Similar articles
-
Hydroids (Cnidaria, Hydrozoa) from Mauritanian Coral Mounds.Zootaxa. 2020 Nov 16;4878(3):zootaxa.4878.3.2. doi: 10.11646/zootaxa.4878.3.2. Zootaxa. 2020. PMID: 33311142
-
First insights into the biodiversity and biogeography of the Southern Ocean deep sea.Nature. 2007 May 17;447(7142):307-11. doi: 10.1038/nature05827. Nature. 2007. PMID: 17507981
-
Ecology of southern ocean pack ice.Adv Mar Biol. 2002;43:171-276. doi: 10.1016/s0065-2881(02)43005-2. Adv Mar Biol. 2002. PMID: 12154613 Review.
-
Antarctic marine biodiversity and deep-sea hydrothermal vents.PLoS Biol. 2012 Jan;10(1):e1001232. doi: 10.1371/journal.pbio.1001232. Epub 2012 Jan 3. PLoS Biol. 2012. PMID: 22235192 Free PMC article.
-
Southern ocean biogeography of tintinnid ciliates of the marine plankton.J Eukaryot Microbiol. 2012 Nov-Dec;59(6):511-9. doi: 10.1111/j.1550-7408.2012.00646.x. Epub 2012 Oct 5. J Eukaryot Microbiol. 2012. PMID: 23039094 Review.
Cited by
-
Diversity, Ecological Role and Biotechnological Potential of Antarctic Marine Fungi.J Fungi (Basel). 2021 May 17;7(5):391. doi: 10.3390/jof7050391. J Fungi (Basel). 2021. PMID: 34067750 Free PMC article. Review.
-
Antarctic food web architecture under varying dynamics of sea ice cover.Sci Rep. 2019 Aug 28;9(1):12454. doi: 10.1038/s41598-019-48245-7. Sci Rep. 2019. PMID: 31462668 Free PMC article.
-
Antarctic Seabed Assemblages in an Ice-Shelf-Adjacent Polynya, Western Weddell Sea.Biology (Basel). 2022 Nov 25;11(12):1705. doi: 10.3390/biology11121705. Biology (Basel). 2022. PMID: 36552215 Free PMC article.
-
Highly diverse, poorly studied and uniquely threatened by climate change: an assessment of marine biodiversity on South Georgia's continental shelf.PLoS One. 2011;6(5):e19795. doi: 10.1371/journal.pone.0019795. Epub 2011 May 25. PLoS One. 2011. PMID: 21647236 Free PMC article.
-
Exploring the Microdiversity Within Marine Bacterial Taxa: Toward an Integrated Biogeography in the Southern Ocean.Front Microbiol. 2021 Jul 14;12:703792. doi: 10.3389/fmicb.2021.703792. eCollection 2021. Front Microbiol. 2021. PMID: 34335536 Free PMC article.
References
-
- Deacon G. The Antarctic circumpolar ocean. Cambridge; New York: Cambridge University Press; 1984. 180
-
- Tréguer P, Jacques G. Dynamics of nutrients and phytoplankton and fluxes of carbon nitrogen and silicon in the Antarctic Ocean. Polar Biol. 1992;12:149–162.
-
- Longhurst A. Ecological geography of the sea. San Diego: Academic Press; 1998. 398
-
- Rintoul SR. Rapid freshening of Antarctic Bottom Water formed in the Indian and Pacific Oceans. Geophys Res Lett. 2007;34:L06606. (doi:101029/2006GL028550)
-
- Orsi AHT, Whitworth T, III, Nowlin WD., Jr On the meridional extent and fronts of the Antarctic Circumpolar Current. Deep-Sea Res. 1995;42:641–673.
Publication types
MeSH terms
LinkOut - more resources
Full Text Sources
Miscellaneous
