Review

The biodiversity of the Mediterranean Sea: estimates, patterns, and threats

Marta Coll et al. PLoS One. .

Abstract

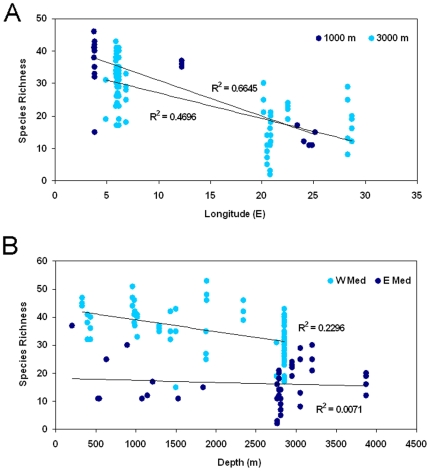
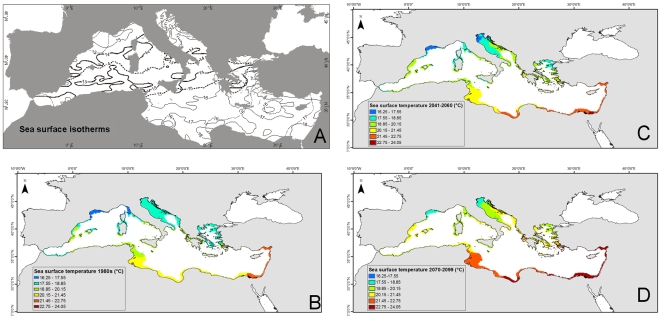
The Mediterranean Sea is a marine biodiversity hot spot. Here we combined an extensive literature analysis with expert opinions to update publicly available estimates of major taxa in this marine ecosystem and to revise and update several species lists. We also assessed overall spatial and temporal patterns of species diversity and identified major changes and threats. Our results listed approximately 17,000 marine species occurring in the Mediterranean Sea. However, our estimates of marine diversity are still incomplete as yet-undescribed species will be added in the future. Diversity for microbes is substantially underestimated, and the deep-sea areas and portions of the southern and eastern region are still poorly known. In addition, the invasion of alien species is a crucial factor that will continue to change the biodiversity of the Mediterranean, mainly in its eastern basin that can spread rapidly northwards and westwards due to the warming of the Mediterranean Sea. Spatial patterns showed a general decrease in biodiversity from northwestern to southeastern regions following a gradient of production, with some exceptions and caution due to gaps in our knowledge of the biota along the southern and eastern rims. Biodiversity was also generally higher in coastal areas and continental shelves, and decreases with depth. Temporal trends indicated that overexploitation and habitat loss have been the main human drivers of historical changes in biodiversity. At present, habitat loss and degradation, followed by fishing impacts, pollution, climate change, eutrophication, and the establishment of alien species are the most important threats and affect the greatest number of taxonomic groups. All these impacts are expected to grow in importance in the future, especially climate change and habitat degradation. The spatial identification of hot spots highlighted the ecological importance of most of the western Mediterranean shelves (and in particular, the Strait of Gibraltar and the adjacent Alboran Sea), western African coast, the Adriatic, and the Aegean Sea, which show high concentrations of endangered, threatened, or vulnerable species. The Levantine Basin, severely impacted by the invasion of species, is endangered as well. This abstract has been translated to other languages (File S1).


Conflict of interest statement

Competing Interests: The authors have declared that no competing interests exist.

Figures

Figure 1
Figure 1. Biogeographic regions and oceanographic features of the Mediterranean Sea.
(A) Main biogeographic regions, basins, and administrative divisions of the Mediterranean Sea, (B) Annual mean sea surface temperature (°C) (2003, NOAA), (C) Annual mean relative primary production (2002, Inland and Marine Waters Unit, Institute for Environment and Sustainability, EU Joint Research Centre, Ispra, Italy), and (D) maximum average depth (m) (NOAA).
Figure 2
Figure 2. Spatial patterns of fish species richness in the Mediterranean Sea based on superimposed expert-drawn maps.
(A) All fish species (n = 625), (B) ray-finned fish species (n = 545), (C) elasmobranchs (n = 80), (D) endemic fish species (n = 79), (E) alien fish species (n = 127) [data modified from 91]. Colors express species occurrence from blue (little or no occurrence) to red (highest occurrence). The size of the cell is 0.1×0.1 degree.
Figure 3
Figure 3. Spatial patterns of vertebrate species richness in the Mediterranean Sea based on superimposed expert-drawn maps (excluding fish species).
(A) resident marine mammals (n = 9), (B) nonresident marine mammals (n = 14), and (C) resident sea turtles (n = 3), as well as sighting records (dots) of the two visiting sea turtles. Colors express species occurrence from blue (little or no occurrence) to red (highest occurrence). (D) Seabird colonies (the yellow dots show the distribution and population density of colonies in breeding pairs (bp) of Audouin's gull: Some dots represent the epicenter of several smaller colonies in archipelagos). The size of the cell is 0.1×0.1 degree.
Figure 4
Figure 4. Patterns of benthic biodiversity in the deep sea of the Mediterranean.
(A) Longitudinal patterns, and (B) bathymetric patterns of benthic nematodes along the open slopes of the European margins. Benthic biodiversity is estimated as the total number of meiofaunal taxa, and as nematode species richness (expected number of nematode species for a theoretical sample of 51 specimens).
Figure 5
Figure 5. Spatial predicted patterns of species richness in the Mediterranean Sea based on the AquaMaps model [80, and File S2].
(A) All species (n = 693), (B) ray-finned fishes (n = 397), (C) elasmobranchs (n = 74), (D) invertebrates (n = 193), (E) marine mammals (n = 16), (F) sea turtles (n = 5). All maps were generated without imposing a probability threshold except for marine mammals, for which we used a probability threshold of ≥0.4. Colors express species occurrence from blue (little or no occurrence) to red (highest occurrence). The size of the cell is 0.5×0.5 degree.
Figure 6
Figure 6. Transects of spatial predicted species richness produced using the AquaMaps model [80, and File S2].
(A) Latitudinal transects, and (B) Longitudinal transects. The contribution of fishes, invertebrates, and marine mammals to geographic gradients in biodiversity is shown.
Figure 7
Figure 7. Bathymetric patterns of species richness.
(A) Bathymetric ranges of distribution for Mediterranean polychaete species at minimum and maximum depths where they have been reported (File S2), and (B) number of Mediterranean cumaceans recorded in each 100 m depth interval (Endemic species are plotted in gray. For nonendemic species only records from the Mediterranean Sea are considered, File S2).
Figure 8
Figure 8. Historical changes and threats of species in the Mediterranean Sea.
(A) Historical trends in the proportion of species being depleted (>50% decline), rare (>90% decline), or extirpated (100% decline) in the North Adriatic Sea, based on data for 64 economically and ecologically important species for which long-term records are available. Temporal trends for alien species refer to recorded exotic mollusks in the whole Mediterranean Sea . (B) Shifts in species diversity of the North Adriatic Sea over historical time scales. Species depletions and extirpations occurred mostly in larger species groups, while invasions occurred in smaller and lower trophic-level species [data from 271]. (C) Threats to diversity in the North Adriatic Sea over historical time scales. Shown is the percent of recorded species depletions and extinctions caused by, or attributed to, different human impacts. Also shown is whether human impacts acted as single or multiple causes. Data were adapted from Lotze et al. .
Figure 9
Figure 9. Distribution of monk seals and nesting sites of marine turtles in the Mediterranean.
Present (red areas) and historical (yellow areas) distribution of the Mediterranean monk seal , , , , –, and nesting sites for loggerhead turtle and green turtle [modified from 22]. Green and red triangles, respectively, are the former nesting sites for loggerhead turtle and green turtle; green and red dots are the present sites. Question marks represent sites where one or a few Mediterranean monk seals have been recently seen.
Figure 10
Figure 10. Current and future threats to biodiversity in the Mediterranean Sea.
We used published data on specific taxa and expert opinion. Threats to diversity were ranked from 0 to 5 for 13 taxonomic groups and results are shown as the percentage of the ranking to the maximum values (File S2).
Figure 11
Figure 11. Past changes in seawater temperature and future projections in the Mediterranean Sea.
(A) recent northward shifting of February sea surface isotherms (°C) in the Mediterranean Sea (broken lines are the one-century climatological means, solid lines the means for 1985–2006: the 14°C and the 15°C “dividers” are highlighted by a thicker tract. Data compiled from MEDATLAS, GOS-MED, NOAA-AVHRR data and various other sources. Seawater surface temperature on the continental shelves is shown (B) during the 1980s (according to the NOAA data), (C) by 2041–2060, and (D) by 2070–2099 [according to the OPAMED8 model based on the A2 IPCC scenario, 120]. The size of the cell is 0.1×0.1 degree.
Figure 12
Figure 12. Biodiversity hot spots for Mediterranean vertebrate species of special conservation concern.
This figure includes 110 critically endangered, endangered, vulnerable, or near threatened species. Results are predictions based on AquaMaps model [80, and File S2] and generated using a probability threshold of occurrence of ≥0.4 to highlight likely areas of critical habitat for each species. Colors express species occurrence from blue (little occurrence) to red (highest occurrence). The size of the cell is 0.5×0.5 degree.
Figure 13
Figure 13. Cumulative numbers of species discovered (described or first recorded) over time in the Mediterranean Sea.
(A) polychaetes, (B) cumaceans, (C) lophogastrids and mysids, and (D) ascidians (File S2).
Figure 14
Figure 14. Diel difference in biodiversity estimates obtained with trawling in the Mediterranean Sea.
Reported diel differences in estimated biodiversity are obtained by two trawl hauls performed at the autumnal equinox at midday and midnight, in the same sampling location of the western Mediterranean shelf (100 m) and slope (400 m), during October 1999 (NERIT survey). (A) Number of fish, crustaceans, and cephalopod species, and Shannon diversity index (H'), and (B) Waveform analysis of four-day time series of data for catches (left) and light intensity variations as photon fluency rate (PFR; right) for representative decapods. Black rectangles depict the temporal limits of significant increases in catches. Shaded gray rectangles indicate the night duration [adapted from 425].

Similar articles

Cited by

References

    1. NOAA, National Oceanic and Atmospheric Administration. 2009. Large marine ecosystems Web page: http://www.lme.noaa.gov/. The Mediterranean LME. Accessed December, 2009.
    1. Bethoux JP. Budgets of the Mediterranean Sea - Their dependance on the local climate and on the characteristics of the Atlantic waters. Oceanologica Acta. 1979;2:157–163.
    1. Hopkins TS. Physics of the sea. In: Margalef R, editor. Key environments: Western Mediterranean. New York: Pergamon Press; 1985.
    1. Pinardi N, Arneri E, Crise A, Ravaioli M, Zavatarelli M. Robinson AR, Brink KA, editors. The physical, sedimentary and ecological structure and variability of shelf areas in the Mediterranean sea (27). The Sea Harvard University Press. 2006. pp. 1245–1331.
    1. Bas C. The Mediterranean: A synoptic overview. Contributions to Science. 2009;5:25–39.

Publication types