

Biodiversity's big wet secret: the global distribution of marine biological records reveals chronic under-exploration of the deep pelagic ocean
- PMID: 20689845
- PMCID: PMC2914017
- DOI: 10.1371/journal.pone.0010223
Biodiversity's big wet secret: the global distribution of marine biological records reveals chronic under-exploration of the deep pelagic ocean
Abstract
Background: Understanding the distribution of marine biodiversity is a crucial first step towards the effective and sustainable management of marine ecosystems. Recent efforts to collate location records from marine surveys enable us to assemble a global picture of recorded marine biodiversity. They also effectively highlight gaps in our knowledge of particular marine regions. In particular, the deep pelagic ocean--the largest biome on Earth--is chronically under-represented in global databases of marine biodiversity.
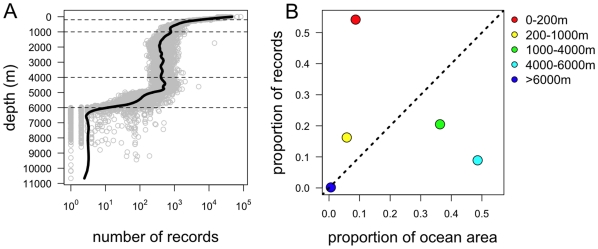
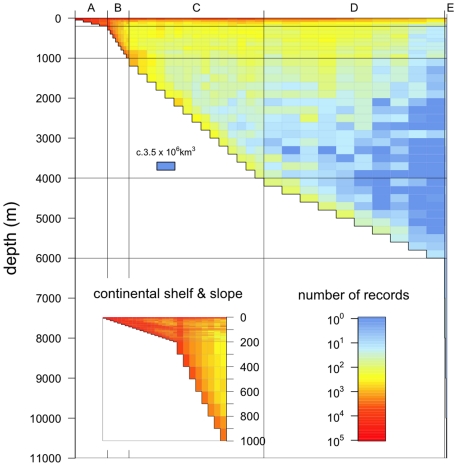
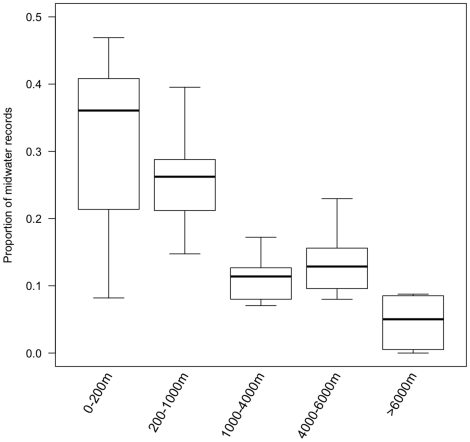
Methodology/principal findings: We use data from the Ocean Biogeographic Information System to plot the position in the water column of ca 7 million records of marine species occurrences. Records from relatively shallow waters dominate this global picture of recorded marine biodiversity. In addition, standardising the number of records from regions of the ocean differing in depth reveals that regardless of ocean depth, most records come either from surface waters or the sea bed. Midwater biodiversity is drastically under-represented.
Conclusions/significance: The deep pelagic ocean is the largest habitat by volume on Earth, yet it remains biodiversity's big wet secret, as it is hugely under-represented in global databases of marine biological records. Given both its value in the provision of a range of ecosystem services, and its vulnerability to threats including overfishing and climate change, there is a pressing need to increase our knowledge of Earth's largest ecosystem.
Conflict of interest statement
Figures
Similar articles
-
Hydroids (Cnidaria, Hydrozoa) from Mauritanian Coral Mounds.Zootaxa. 2020 Nov 16;4878(3):zootaxa.4878.3.2. doi: 10.11646/zootaxa.4878.3.2. Zootaxa. 2020. PMID: 33311142
-
Antarctic marine biodiversity--what do we know about the distribution of life in the Southern Ocean?PLoS One. 2010 Aug 2;5(8):e11683. doi: 10.1371/journal.pone.0011683. PLoS One. 2010. PMID: 20689841 Free PMC article. Review.
-
Ecological variables for developing a global deep-ocean monitoring and conservation strategy.Nat Ecol Evol. 2020 Feb;4(2):181-192. doi: 10.1038/s41559-019-1091-z. Epub 2020 Feb 3. Nat Ecol Evol. 2020. PMID: 32015428 Review.
-
Ecology of southern ocean pack ice.Adv Mar Biol. 2002;43:171-276. doi: 10.1016/s0065-2881(02)43005-2. Adv Mar Biol. 2002. PMID: 12154613 Review.
-
Global patterns of bacterial beta-diversity in seafloor and seawater ecosystems.PLoS One. 2011;6(9):e24570. doi: 10.1371/journal.pone.0024570. Epub 2011 Sep 8. PLoS One. 2011. PMID: 21931760 Free PMC article.
Cited by
-
Global-scale relationships between colonization ability and range size in marine and freshwater fish.PLoS One. 2012;7(11):e49465. doi: 10.1371/journal.pone.0049465. Epub 2012 Nov 21. PLoS One. 2012. PMID: 23185338 Free PMC article.
-
Diversity of Bacterioplankton and Bacteriobenthos from the Veracruz Reef System, Southwestern Gulf of Mexico.Microorganisms. 2021 Mar 17;9(3):619. doi: 10.3390/microorganisms9030619. Microorganisms. 2021. PMID: 33802890 Free PMC article.
-
Assessing patterns of metazoans in the global ocean using environmental DNA.R Soc Open Sci. 2024 Aug 14;11(8):240724. doi: 10.1098/rsos.240724. eCollection 2024 Aug. R Soc Open Sci. 2024. PMID: 39144493 Free PMC article.
-
Reduced evolutionary constraint accompanies ongoing radiation in deep-sea anglerfishes.Nat Ecol Evol. 2025 Mar;9(3):474-490. doi: 10.1038/s41559-024-02586-3. Epub 2024 Nov 27. Nat Ecol Evol. 2025. PMID: 39604701
-
High-seas fish biodiversity is slipping through the governance net.Nat Ecol Evol. 2019 Sep;3(9):1273-1276. doi: 10.1038/s41559-019-0981-4. Nat Ecol Evol. 2019. PMID: 31451786 No abstract available.
References
-
- Holt RD. 2020 Visions: Ecology. Nature. 2010;463:32.
-
- Somerfield PJ, Arvanitidis C, Vanden Berghe E, van Avesaath P, Hummel H, et al. MarBEF, databases, and the legacy of John Gray. Mar Ecol Prog Ser. 2009;382:221–224.
-
- Vanden Berghe E, Claus S, Appeltans W, Faulwetter S, Arvanitidis C, et al. MacroBen integrated database on benthic invertebrates of European continental shelves: a tool for large-scale analysis across Europe. Mar Ecol Prog Ser. 2009;382:225–238.
-
- Clark MR, Rowden AA, Schlacher R, Williams A, Consalvey M, et al. The ecology of seamounts: structure, function, and human impacts. Ann Rev Marine Sci. 2010;2:253–278. - PubMed
