

Deep-sea biodiversity in the Mediterranean Sea: the known, the unknown, and the unknowable
- PMID: 20689848
- PMCID: PMC2914020
- DOI: 10.1371/journal.pone.0011832
Deep-sea biodiversity in the Mediterranean Sea: the known, the unknown, and the unknowable
Abstract
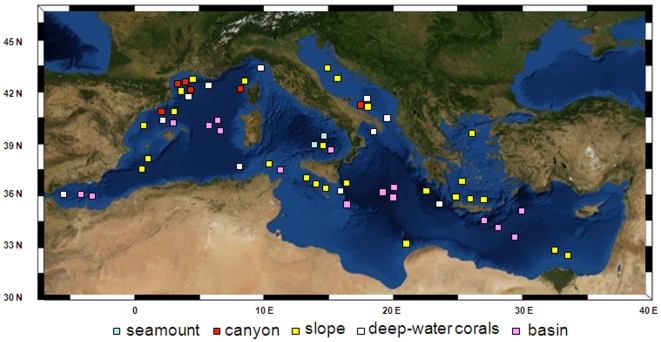
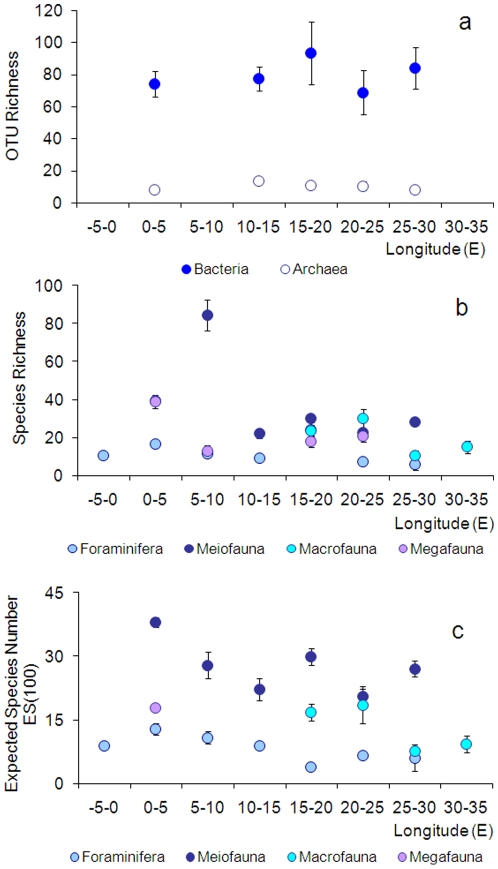
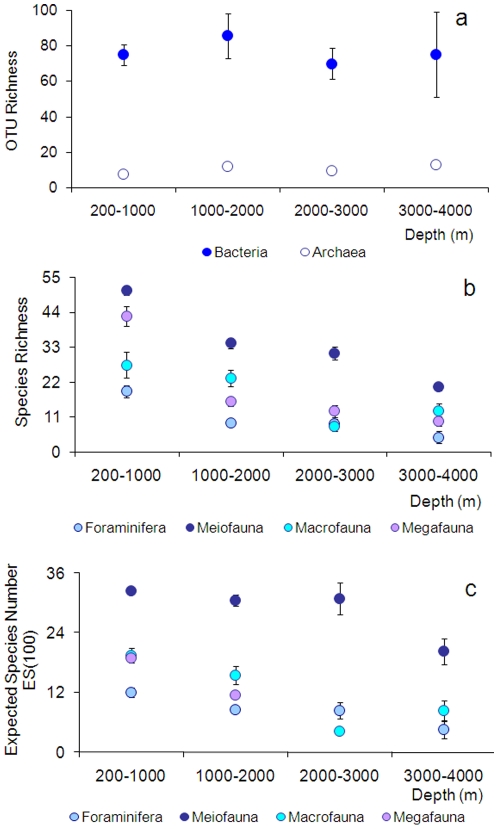
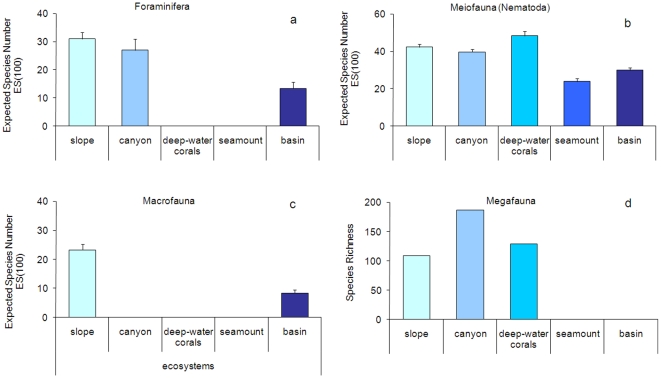
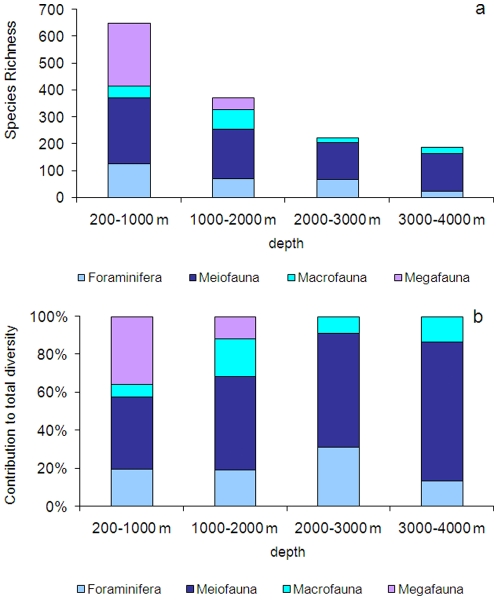
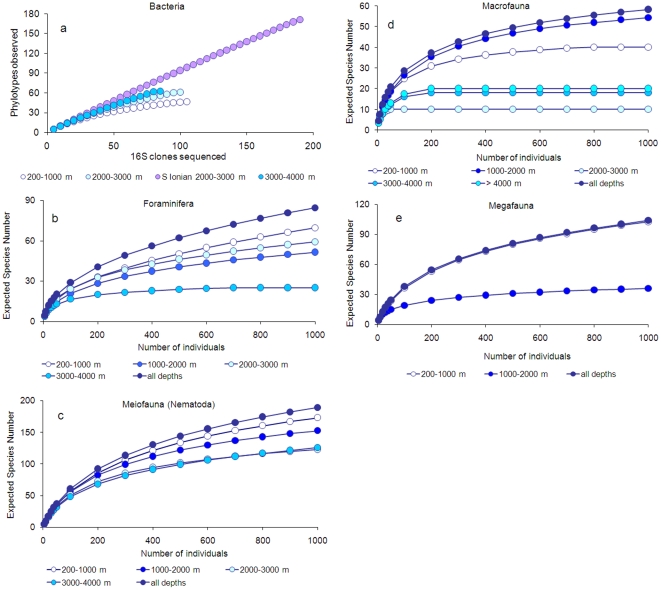
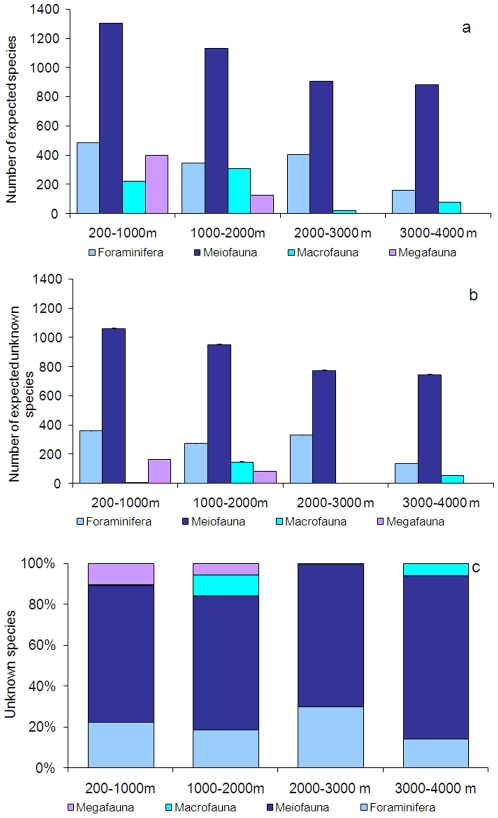
Deep-sea ecosystems represent the largest biome of the global biosphere, but knowledge of their biodiversity is still scant. The Mediterranean basin has been proposed as a hot spot of terrestrial and coastal marine biodiversity but has been supposed to be impoverished of deep-sea species richness. We summarized all available information on benthic biodiversity (Prokaryotes, Foraminifera, Meiofauna, Macrofauna, and Megafauna) in different deep-sea ecosystems of the Mediterranean Sea (200 to more than 4,000 m depth), including open slopes, deep basins, canyons, cold seeps, seamounts, deep-water corals and deep-hypersaline anoxic basins and analyzed overall longitudinal and bathymetric patterns. We show that in contrast to what was expected from the sharp decrease in organic carbon fluxes and reduced faunal abundance, the deep-sea biodiversity of both the eastern and the western basins of the Mediterranean Sea is similarly high. All of the biodiversity components, except Bacteria and Archaea, displayed a decreasing pattern with increasing water depth, but to a different extent for each component. Unlike patterns observed for faunal abundance, highest negative values of the slopes of the biodiversity patterns were observed for Meiofauna, followed by Macrofauna and Megafauna. Comparison of the biodiversity associated with open slopes, deep basins, canyons, and deep-water corals showed that the deep basins were the least diverse. Rarefaction curves allowed us to estimate the expected number of species for each benthic component in different bathymetric ranges. A large fraction of exclusive species was associated with each specific habitat or ecosystem. Thus, each deep-sea ecosystem contributes significantly to overall biodiversity. From theoretical extrapolations we estimate that the overall deep-sea Mediterranean biodiversity (excluding prokaryotes) reaches approximately 2805 species of which about 66% is still undiscovered. Among the biotic components investigated (Prokaryotes excluded), most of the unknown species are within the phylum Nematoda, followed by Foraminifera, but an important fraction of macrofaunal and megafaunal species also remains unknown. Data reported here provide new insights into the patterns of biodiversity in the deep-sea Mediterranean and new clues for future investigations aimed at identifying the factors controlling and threatening deep-sea biodiversity.
Conflict of interest statement
Figures
References
-
- Gage JD, Tyler PA. Deep sea biology: A natural history of organisms at the deep-sea floor. Cambridge: Cambridge University Press; 1991. 504
-
- Snelgrove PVR. Getting to the bottom of marine biodiversity: Sedimentary habitats. BioScience. 1999;49:129–138.
-
- Grassle JF, Maciolek NJ. Deep-sea species richness: Regional and local diversity estimates from quantitative bottom samples. Am Nat. 1992;139:313–341.
-
- Etter RJ, Grassle JF. Patterns of species diversity in the deep sea as a function of sediment particle size diversity. Nature. 1992;369:576–578.
-
- Blake JA, Grassle JF. Benthic community structure on the US South Atlantic slope off the Carolinas: Spatial heterogeneity in a current-dominated system. Deep Sea Res II. 1994;41:835–874.
Publication types
MeSH terms
LinkOut - more resources
Full Text Sources
