Mesenchymal stem cell labeling and in vitro MR characterization at 1.5 T of new SPIO contrast agent: Molday ION Rhodamine-B™
- PMID: 20690161
- PMCID: PMC4410881
- DOI: 10.1002/cmmi.396
Mesenchymal stem cell labeling and in vitro MR characterization at 1.5 T of new SPIO contrast agent: Molday ION Rhodamine-B™
Abstract
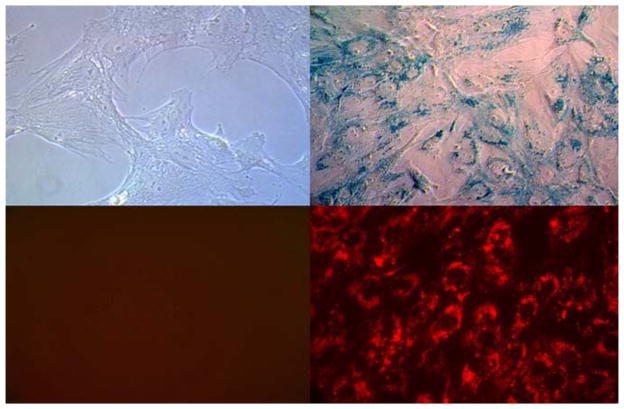
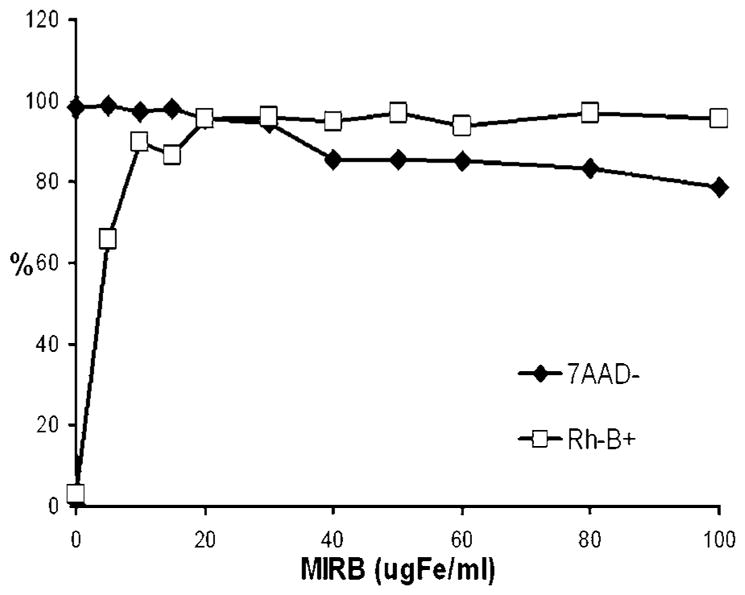
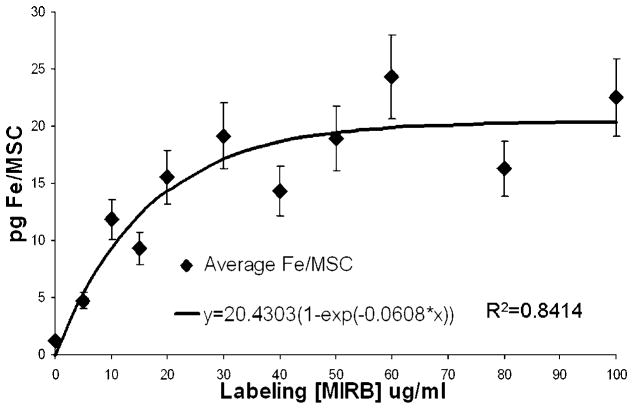
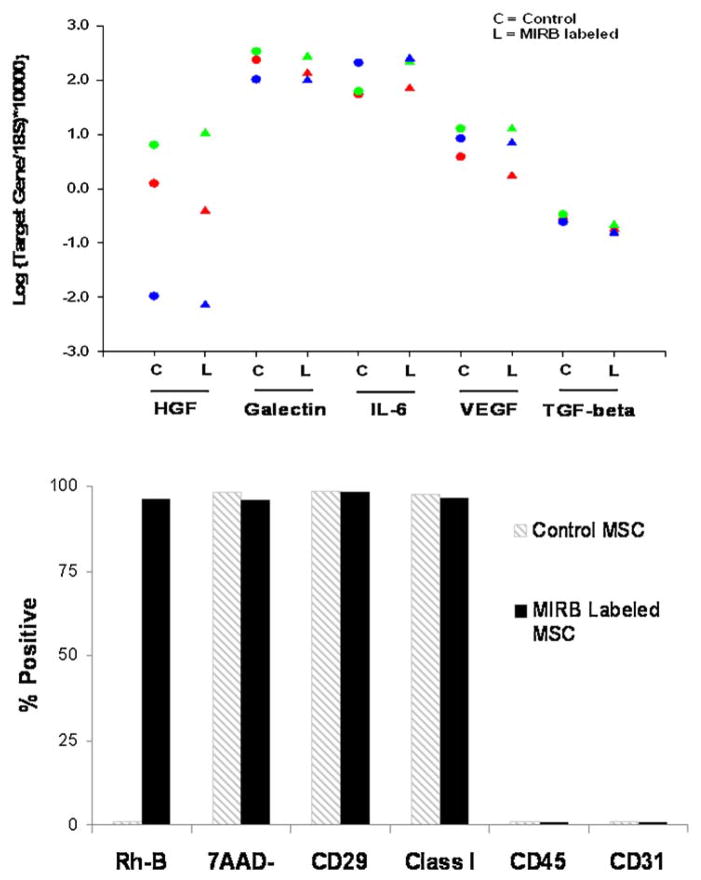
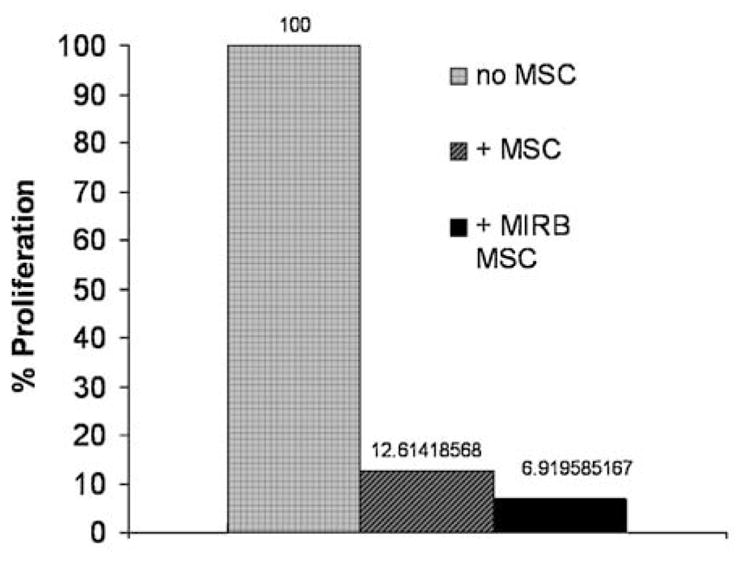
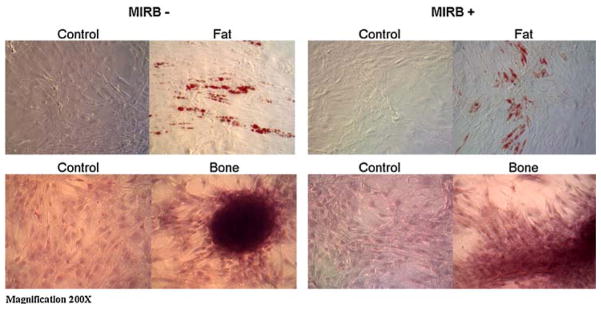
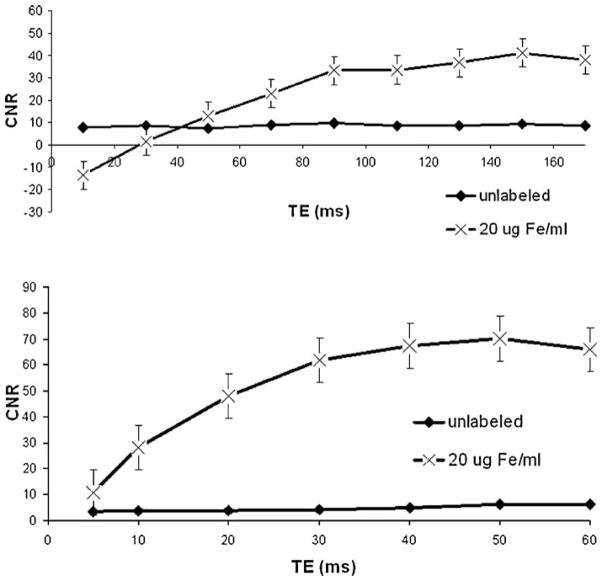
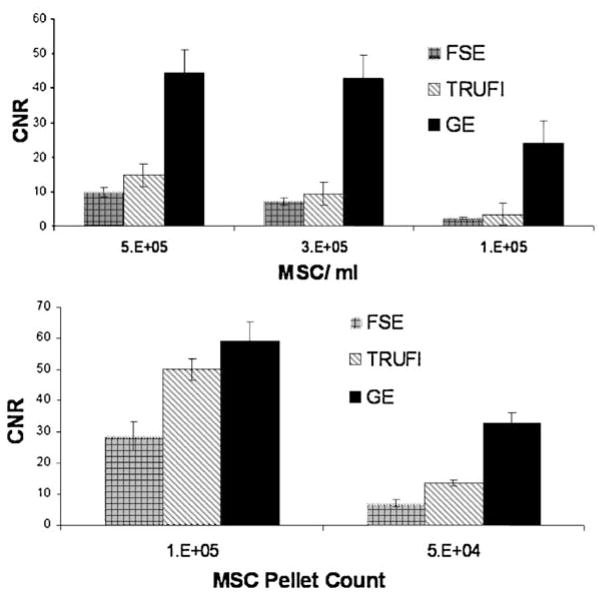
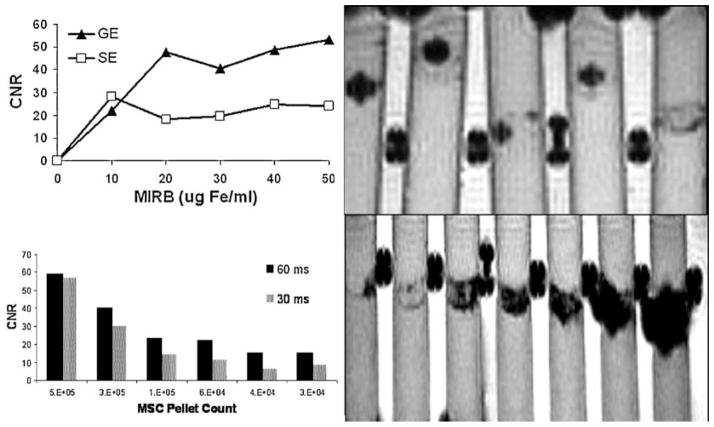
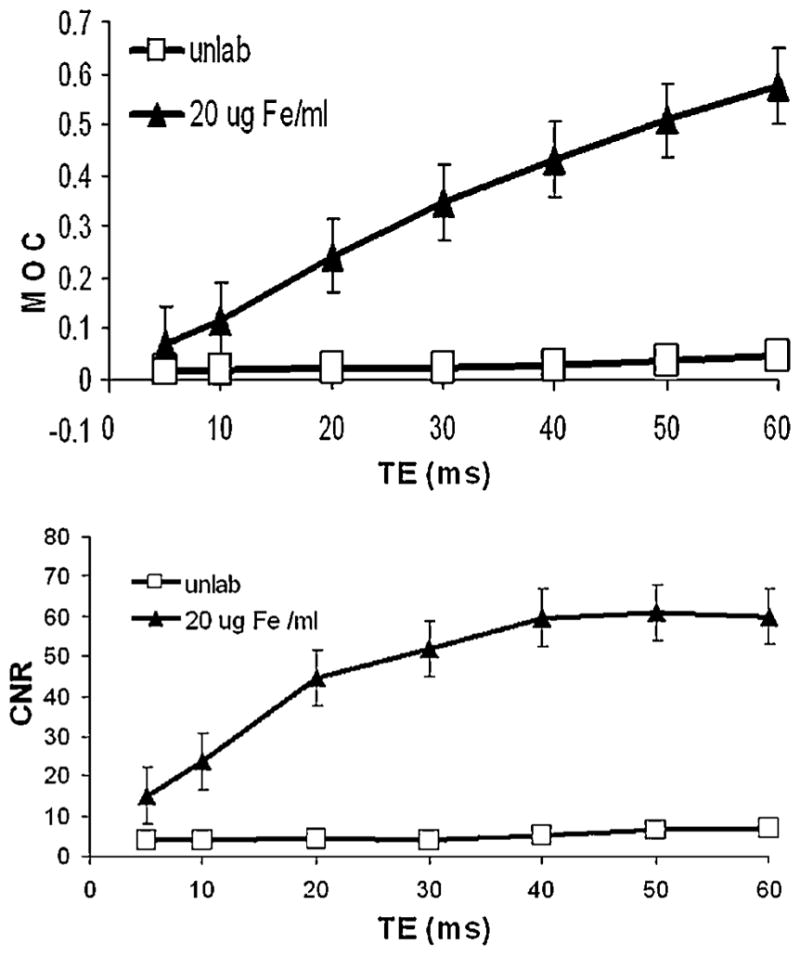
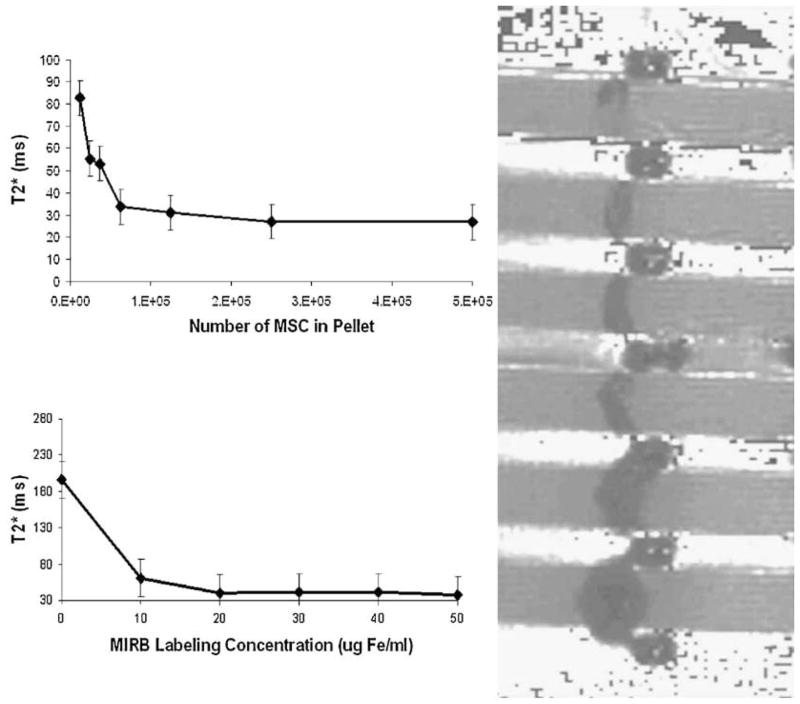
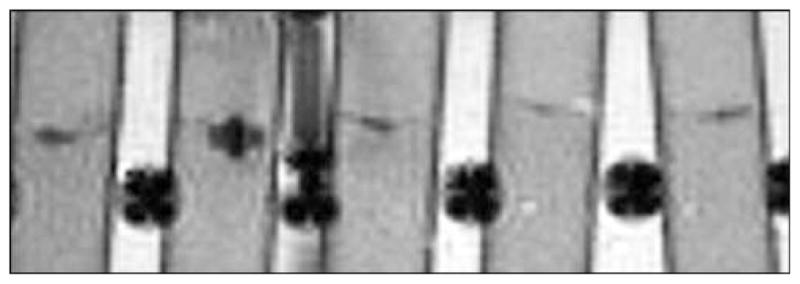
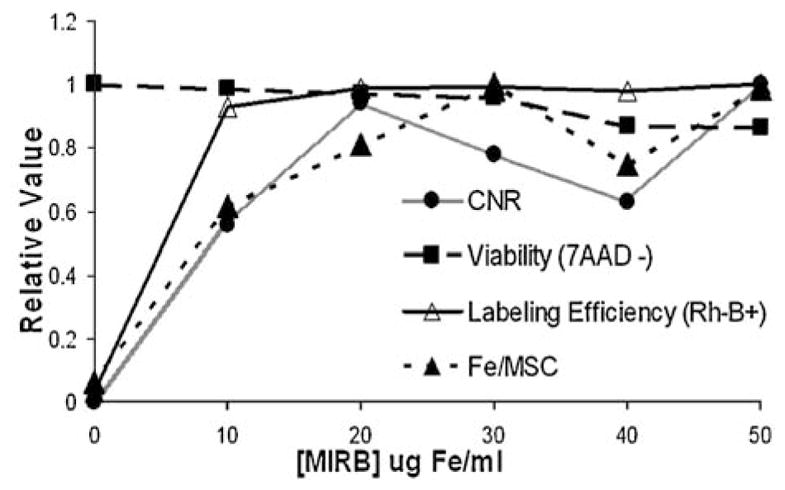
In vivo detection of transplanted stem cells is requisite for improving stem cell-based treatments by developing a thorough understanding of their therapeutic mechanisms. MRI tracking of magnetically labeled cells is non-invasive and is suitable for longitudinal studies. Molday ION Rhodamine-B™ (MIRB) is a new superparamagnetic iron oxide (SPIO) contrast agent specifically formulated for cell labeling and is readily internalized by non-phagocytic cells. This investigation characterizes mesenchymal stem cell (MSC) labeling and MR imaging properties of this new SPIO agent. Effects of MIRB on MSC viability and differentiation as well as cellular loading properties were assessed for MSC labeled with MIRB at concentrations from 5 to 100 µg Fe/ml. Labeled MSC were evaluated, in vitro, on a clinical 1.5 T MRI. Optimal scanning sequences and imaging parameters were determined based on contrast-to-noise ratio and contrast modulation. Relaxation rates (1/T(2)*) for gradient-echo sequences were approximated and an idealized limit of detection was established. MIRB labeling did not affect MSC viability or the ability to differentiate into either bone or fat. Labeling efficiency was found to be approximately 95% for labeling concentrations at or above 20 µg Fe/ml. Average MIRB per MSC ranged from 0.7 pg Fe for labeling MIRB concentration of 5 µg Fe/ml and asymptotically approached a value of 20-25 pg Fe/MSC as labeling concentration increased to 100 µg Fe/ml. MRI analysis of MIRB MSC revealed long echo time, gradient echo sequences to provide the most sensitivity. Limit of detection for gradient echo sequences was determined to be less than 1000 MSC, with approximately 15 pg Fe/MSC (labeled at 20 µg Fe/ml). These investigations have laid the groundwork and established feasibility for the use of this contrast agent for in vivo MRI detection of MSC. Properties evaluated in this study will be used as a reference for tracking labeled MSC for in vivo studies.
Copyright © 2010 John Wiley & Sons, Ltd.
Figures
References
-
- Adler ED, Bystrup A, Briley-Saebo KC, Mani V, Young W, Giovanonne S, Altman P, Kattman SJ, Frank JA, Weinmann HJ, Keller GM, Fayad ZA. In vivo detection of embryonic stem cell-derived cardiovascular progenitor cells using Cy3-labeled Gadofluorine M in murine myocardium. JACC Cardiovasc Imag. 2009;2(9):1114–1122. - PMC - PubMed
-
- Brekke C, Williams SC, Price J, Thorsen F, Modo M. Cellular multiparametric MRI of neural stem cell therapy in a rat glioma model. Neuroimage. 2007;37(3):769–782. - PubMed
-
- Guzman R, Uchida N, Bliss TM, He D, Christopherson KK, Stellwagen D, Capela A, Greve J, Malenka RC, Moseley ME, Palmer TD, Steinberg GK. Long-term monitoring of transplanted human neural stem cells in developmental and pathological contexts with MRI. Proc Natl Acad Sci USA. 2007;104(24):10211–10216. - PMC - PubMed
-
- Higuchi T, Anton M, Dumler K, Seidl S, Pelisek J, Saraste A, Welling A, Hofmann F, Oostendorp RA, Gansbacher B, Nekolla SG, Bengel FM, Botnar RM, Schwaiger M. Combined reporter gene PET and iron oxide MRI for monitoring survival and localization of transplanted cells in the rat heart. J Nucl Med. 2009;50(7):1088–1094. - PubMed
Publication types
MeSH terms
Substances
Grants and funding
LinkOut - more resources
Full Text Sources
Medical