

Interlaboratory comparison of backscatter coefficient estimates for tissue-mimicking phantoms
- PMID: 20690431
- PMCID: PMC3132101
- DOI: 10.1177/016173461003200104
Interlaboratory comparison of backscatter coefficient estimates for tissue-mimicking phantoms
Abstract
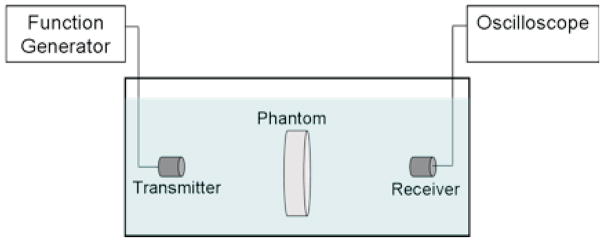
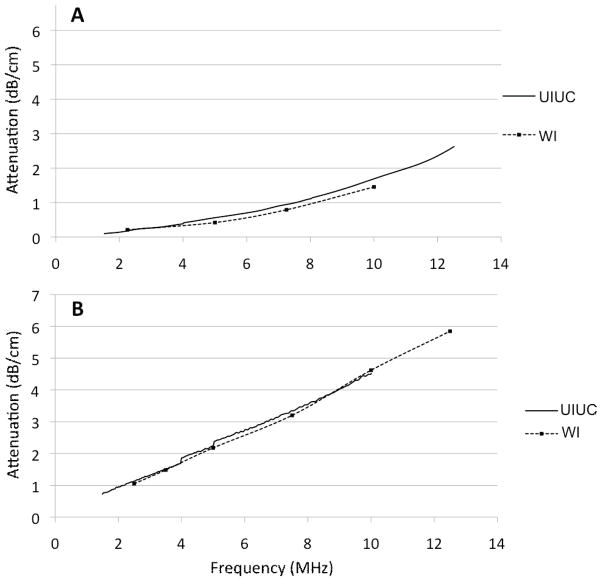
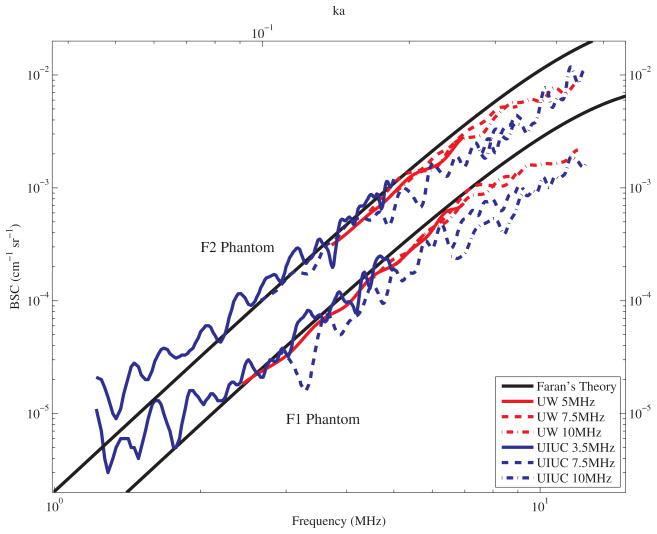
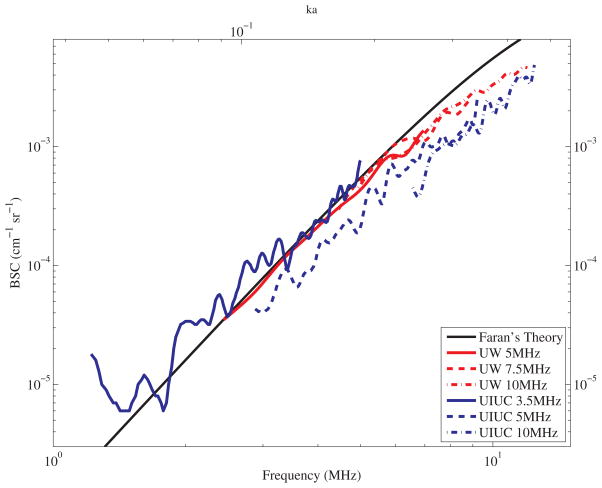
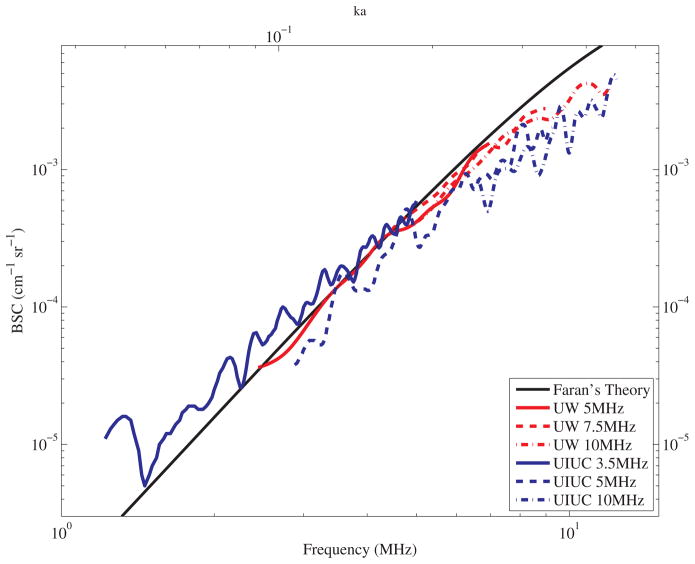
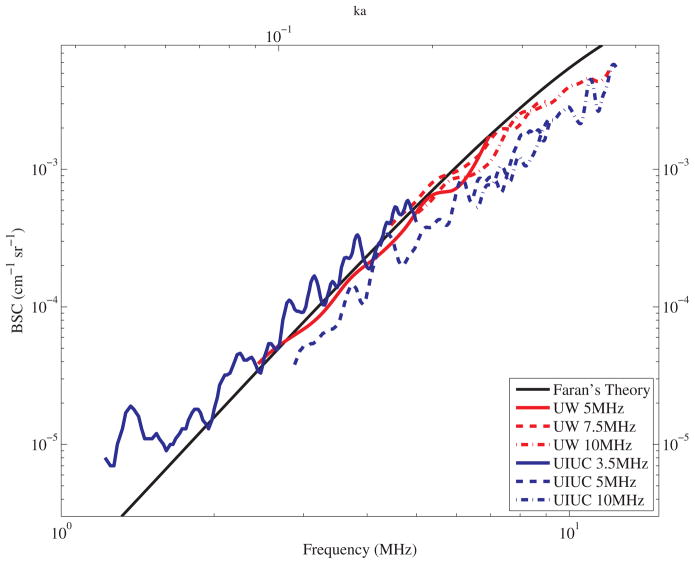
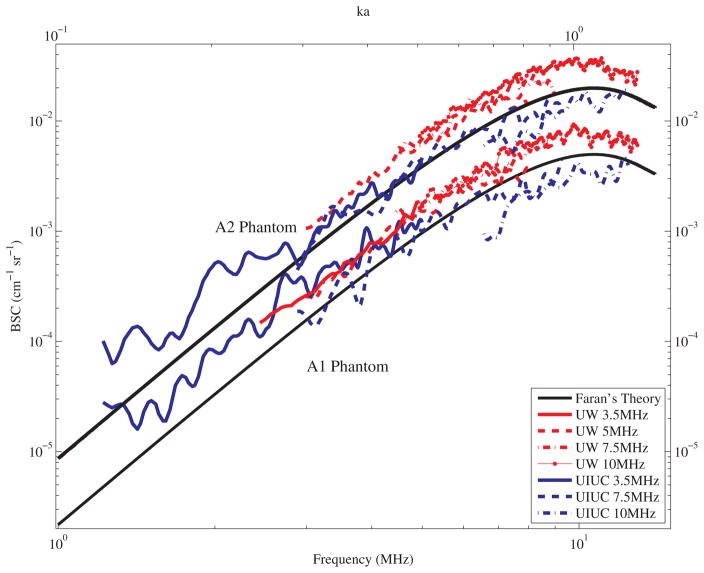
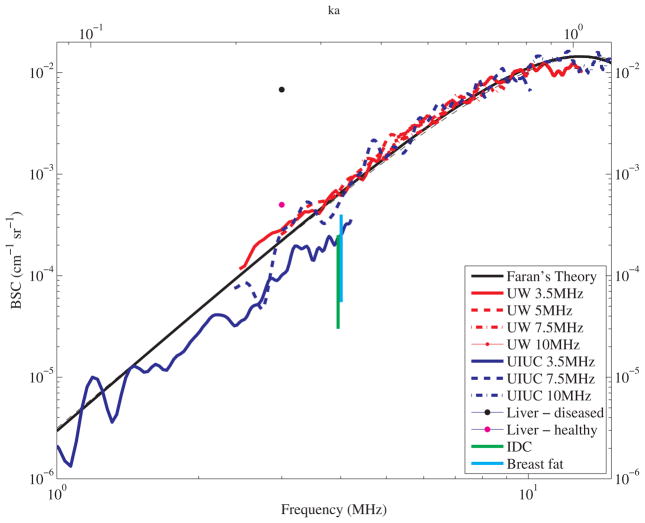
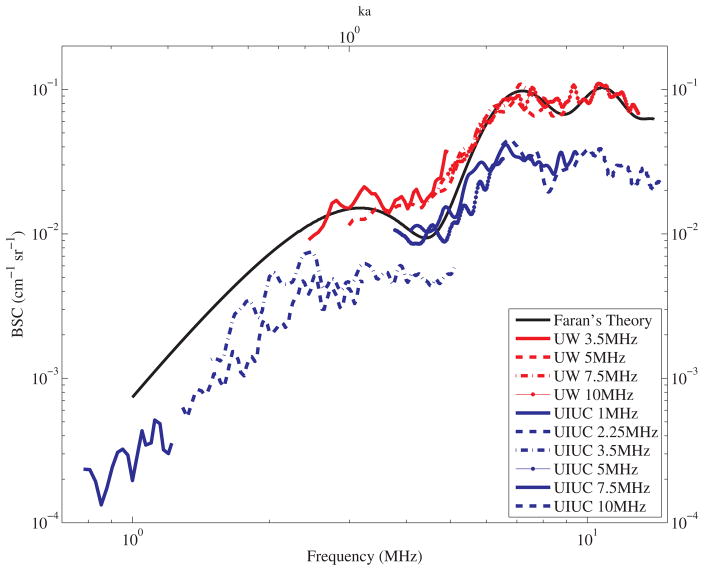
Ultrasonic backscatter is useful for characterizing tissues and several groups have reported methods for estimating backscattering properties. Previous interlaboratory comparisons have been made to test the ability to accurately estimate the backscatter coefficient (BSC) by different laboratories around the world. Results of these comparisons showed variability in BSC estimates but were acquired only for a relatively narrow frequency range, and, most importantly, lacked reference to any independent predictions from scattering theory. The goal of this study was to compare Faran-scattering-theory predictions with cooperatively-measured backscatter coefficients for low-attenuating and tissue-like attenuating phantoms containing glass sphere scatterers of different sizes for which BSCs can independently be predicted. Ultrasonic backscatter measurementswere made for frequencies from 1 to 12 MHz. Backscatter coefficients were estimated using two different planar-reflector techniques at two laboratories for two groups of phantoms. Excellent agreement was observed between BSC estimates from both laboratories. In addition, good agreement with the predictions of Faran's theory was obtained, with average fractional (bias) errors ranging from 8-14%. This interlaboratory comparison demonstrates the ability to accurately estimate parameters derived from the BSC, including an effective scatterer size and the acoustic concentration, both of which may prove useful for diagnostic applications of ultrasound tissue characterization.
Figures
References
-
- Madsen EL, Insana MF, Zagzebski JA. Method of data reduction for accurate determination of acoustic backscatter coefficients. J Acoust Soc Am. 1984;76:913–923. - PubMed
-
- Faran JJ., Jr Sound scattering by solid cylinders and spheres. J Acoust Soc Am. 1951;23:405–418.
-
- Burke TM, Goodsitt MM, Madsen EL, et al. Angular distribution of scattered ultrasound from a single steel sphere in agar gelatin: a comparison between theory and experiment. Ultrasonic Imaging. 1984;6:342–347. - PubMed
-
- Davros WJ, Zagzebski JA, Madsen EL. Frequency-dependent angular scattering of ultrasound by tissue-mimicking materials and excised tissue. J Acoust Soc Am. 1986;80:229–237. - PubMed
-
- Insana MF, Madsen EL, Hall TJ, Zagzebski JA. Tests of the accuracy of a data reduction method for determination of acoustic backscatter coefficients. J Acoust Soc Am. 1986;79:1230–1236. - PubMed
Publication types
MeSH terms
Substances
Grants and funding
LinkOut - more resources
Full Text Sources
