

Contrasting methods of quantifying fine structure of human recombination
- PMID: 20690817
- PMCID: PMC2980829
- DOI: 10.1146/annurev-genom-082908-150031
Contrasting methods of quantifying fine structure of human recombination
Abstract
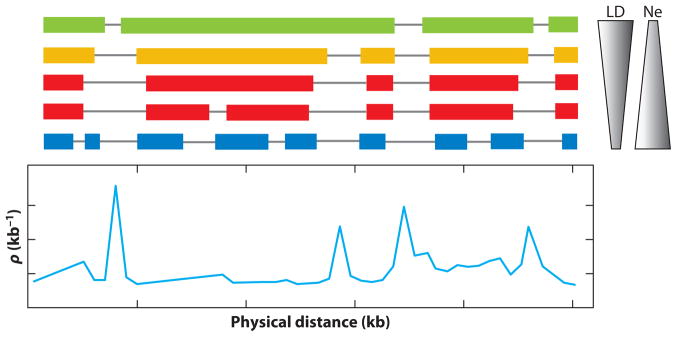
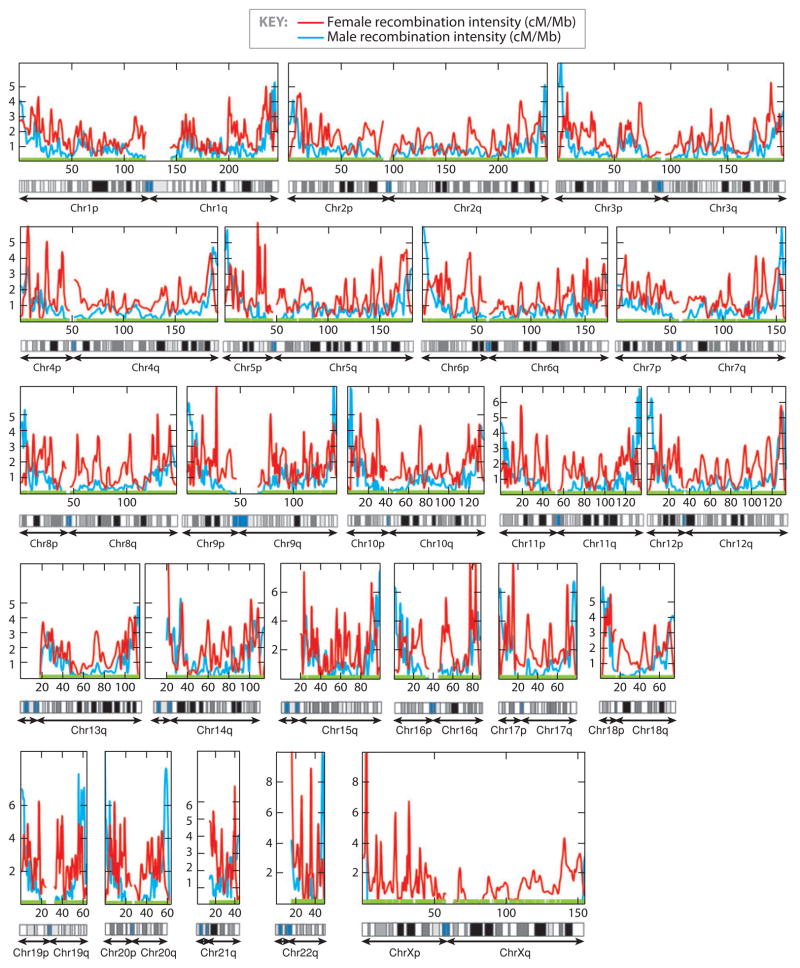
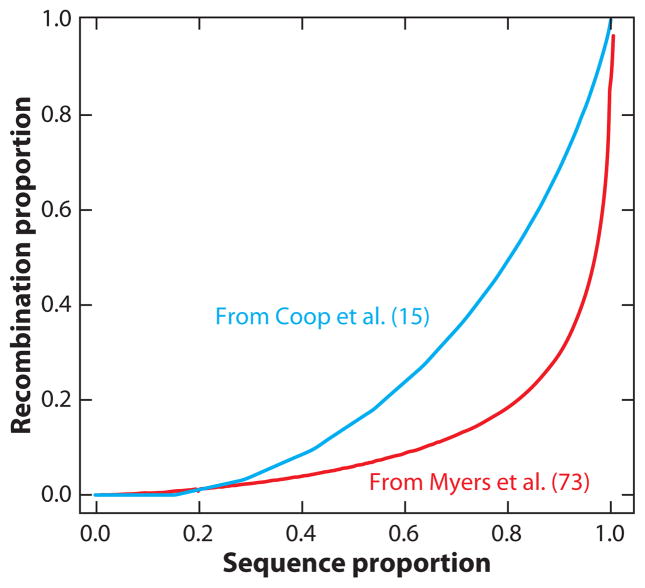
There has been considerable excitement over the ability to construct linkage maps based only on genome-wide genotype data for single nucleotide polymorphic sites (SNPs) in a population sample. These maps, which are derived from estimates of linkage disequilibrium (LD), rely on population genetics theory to relate the decay of LD to the local rate of recombination, but other population processes also come into play. Here we contrast these LD maps to the classically derived, pedigree-based human recombination maps. The LD maps have a level of resolution greatly exceeding that of the pedigree maps, and at this fine scale, sperm typing allows a means of validation. While at a gross level both the pedigree maps and the sperm typing methods generally agree with LD maps, there are significant local differences between them, and the fact that these maps measure different genetic features should be remembered when using them for other genetic inferences.
Conflict of interest statement
The authors are not aware of any affiliations, memberships, funding, or financial holdings that might be perceived as affecting the objectivity of this review.
Figures

Similar articles
-
Mapping genes for common diseases: the case for genetic (LD) maps.Hum Hered. 2004;58(1):2-9. doi: 10.1159/000081451. Hum Hered. 2004. PMID: 15604559
-
Insights into recombination from patterns of linkage disequilibrium in humans.Genetics. 2004 May;167(1):387-97. doi: 10.1534/genetics.167.1.387. Genetics. 2004. PMID: 15166163 Free PMC article.
-
Linkage disequilibrium and inference of ancestral recombination in 538 single-nucleotide polymorphism clusters across the human genome.Am J Hum Genet. 2003 Aug;73(2):285-300. doi: 10.1086/377138. Epub 2003 Jul 3. Am J Hum Genet. 2003. PMID: 12844287 Free PMC article.
-
Linkage disequilibrium in humans: models and data.Am J Hum Genet. 2001 Jul;69(1):1-14. doi: 10.1086/321275. Epub 2001 Jun 14. Am J Hum Genet. 2001. PMID: 11410837 Free PMC article. Review.
-
Linkage disequilibrium maps and disease-association mapping.Methods Mol Biol. 2007;376:109-21. doi: 10.1007/978-1-59745-389-9_8. Methods Mol Biol. 2007. PMID: 17984541 Review.
Cited by
-
A comparative study of the recombination pattern in three species of Platyrrhini monkeys (primates).Chromosoma. 2011 Oct;120(5):521-30. doi: 10.1007/s00412-011-0329-6. Epub 2011 Jul 7. Chromosoma. 2011. PMID: 21735165
-
Recombination correlates with synaptonemal complex length and chromatin loop size in bovids-insights into mammalian meiotic chromosomal organization.Chromosoma. 2017 Oct;126(5):615-631. doi: 10.1007/s00412-016-0624-3. Epub 2017 Jan 18. Chromosoma. 2017. PMID: 28101670
-
Strong artificial selection in domestic mammals did not result in an increased recombination rate.Mol Biol Evol. 2015 Feb;32(2):510-23. doi: 10.1093/molbev/msu322. Epub 2014 Nov 19. Mol Biol Evol. 2015. PMID: 25414125 Free PMC article.
-
Recombination rates in admixed individuals identified by ancestry-based inference.Nat Genet. 2011 Jul 20;43(9):847-53. doi: 10.1038/ng.894. Nat Genet. 2011. PMID: 21775992 Free PMC article.
-
Recombination is associated with the evolution of genome structure and worker behavior in honey bees.Proc Natl Acad Sci U S A. 2012 Oct 30;109(44):18012-7. doi: 10.1073/pnas.1208094109. Epub 2012 Oct 15. Proc Natl Acad Sci U S A. 2012. PMID: 23071321 Free PMC article.
References
-
- Arnheim N, Calabrese P, Tiemann-Boege I. Mammalian meiotic recombination hot spots. Annu Rev Genet. 2007;41:369–99. - PubMed
Publication types
MeSH terms
Grants and funding
LinkOut - more resources
Full Text Sources
Research Materials
