

Genetic associations of brain structural networks in schizophrenia: a preliminary study
- PMID: 20691427
- PMCID: PMC2990476
- DOI: 10.1016/j.biopsych.2010.06.002
Genetic associations of brain structural networks in schizophrenia: a preliminary study
Abstract
Background: Schizophrenia is a complex genetic disorder, with multiple putative risk genes and many reports of reduced cortical gray matter. Identifying the genetic loci contributing to these structural alterations in schizophrenia (and likely also to normal structural gray matter patterns) could aid understanding of schizophrenia's pathophysiology. We used structural parameters as potential intermediate illness markers to investigate genomic factors derived from single nucleotide polymorphism (SNP) arrays.
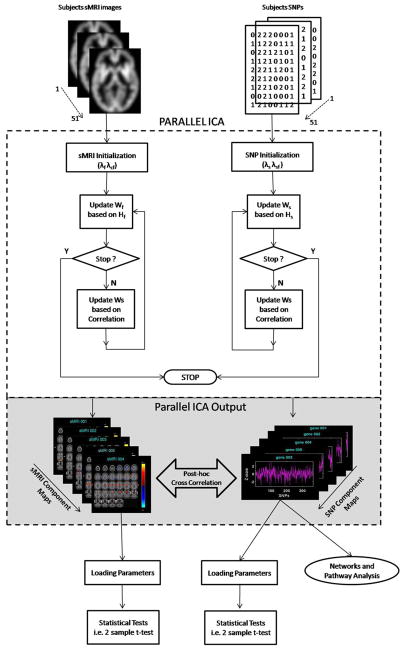
Method: We used research quality structural magnetic resonance imaging (sMRI) scans from European American subjects including 33 healthy control subjects and 18 schizophrenia patients. All subjects were genotyped for 367 SNPs. Linked sMRI and genetic (SNP) components were extracted to reveal relationships between brain structure and SNPs, using parallel independent component analysis, a novel multivariate approach that operates effectively in small sample sizes.
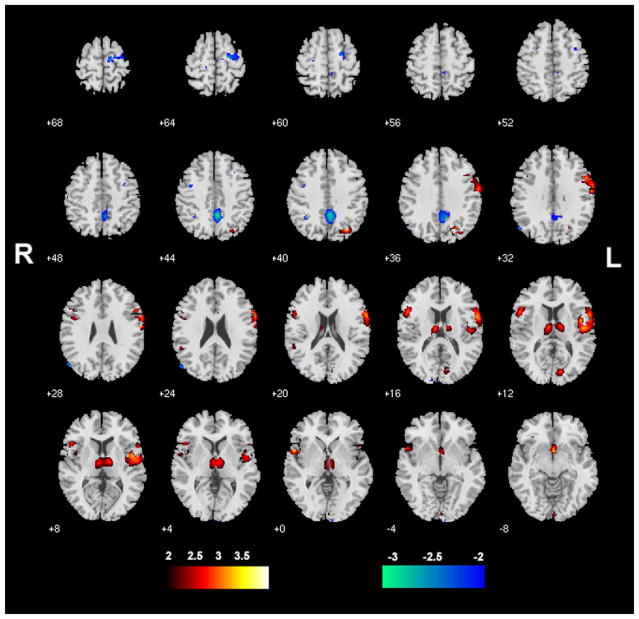
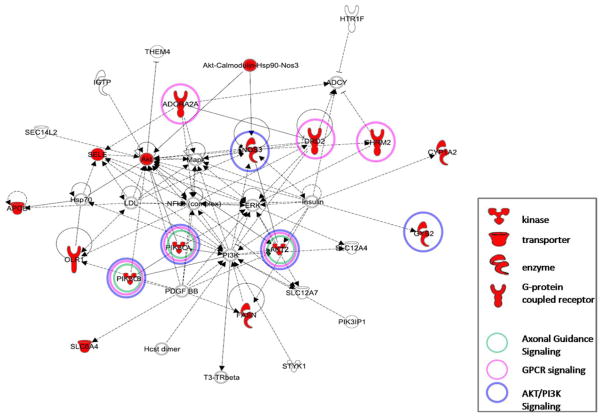
Results: We identified an sMRI component that significantly correlated with a genetic component (r = -.536, p < .00005); components also distinguished groups. In the sMRI component, schizophrenia gray matter deficits were in brain regions consistently implicated in previous reports, including frontal and temporal lobes and thalamus (p < .01). These deficits were related to SNPs from 16 genes, several previously associated with schizophrenia risk and/or involved in normal central nervous system development, including AKT, PI3K, SLC6A4, DRD2, CHRM2, and ADORA2A.
Conclusions: Despite the small sample size, this novel analysis method identified an sMRI component including brain areas previously reported to be abnormal in schizophrenia and an associated genetic component containing several putative schizophrenia risk genes. Thus, we identified multiple genes potentially underlying specific structural brain abnormalities in schizophrenia.
Published by Elsevier Inc.
Conflict of interest statement
All authors reported no biomedical financial interests or potential conflicts of interest.
Figures
References
-
- Goldman AL, Pezawas L, Mattay VS, Fischl B, Verchinski BA, Zoltick B, et al. Heritability of brain morphology related to schizophrenia: a large-scale automated magnetic resonance imaging segmentation study. Biol Psychiatry. 2008;63:475–483. - PubMed
-
- Cicchetti D, Cannon TD. Neurodevelopmental processes in the ontogenesis and epigenesis of psychopathology. Dev Psychopathol. 1999;11:375–393. - PubMed
-
- Wright IC, Sham P, Murray RM, Weinberger DR, Bullmore ET. Genetic contributions to regional variability in human brain structure: Methods and preliminary results. Neuroimage. 2002;17:256–271. - PubMed
Publication types
MeSH terms
Substances
Grants and funding
LinkOut - more resources
Full Text Sources
Medical
Molecular Biology Databases
