. 2010 Sep 14;20(17):1499-510.
doi: 10.1016/j.cub.2010.06.075. Epub 2010 Aug 5.

Sequential activation of apical and basolateral contractility drives ascidian endoderm invagination

Affiliations

Sequential activation of apical and basolateral contractility drives ascidian endoderm invagination

Kristin Sherrard et al. Curr Biol. .

Abstract

Background: Epithelial invagination is a fundamental morphogenetic behavior that transforms a flat cell sheet into a pit or groove. Previous studies of invagination have focused on the role of actomyosin-dependent apical contraction; other mechanisms remain largely unexplored.

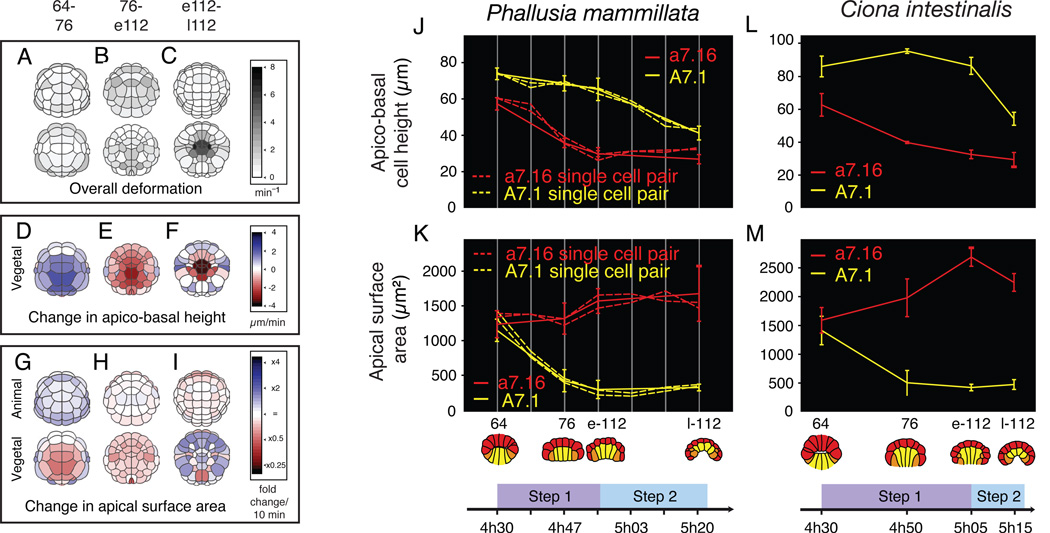
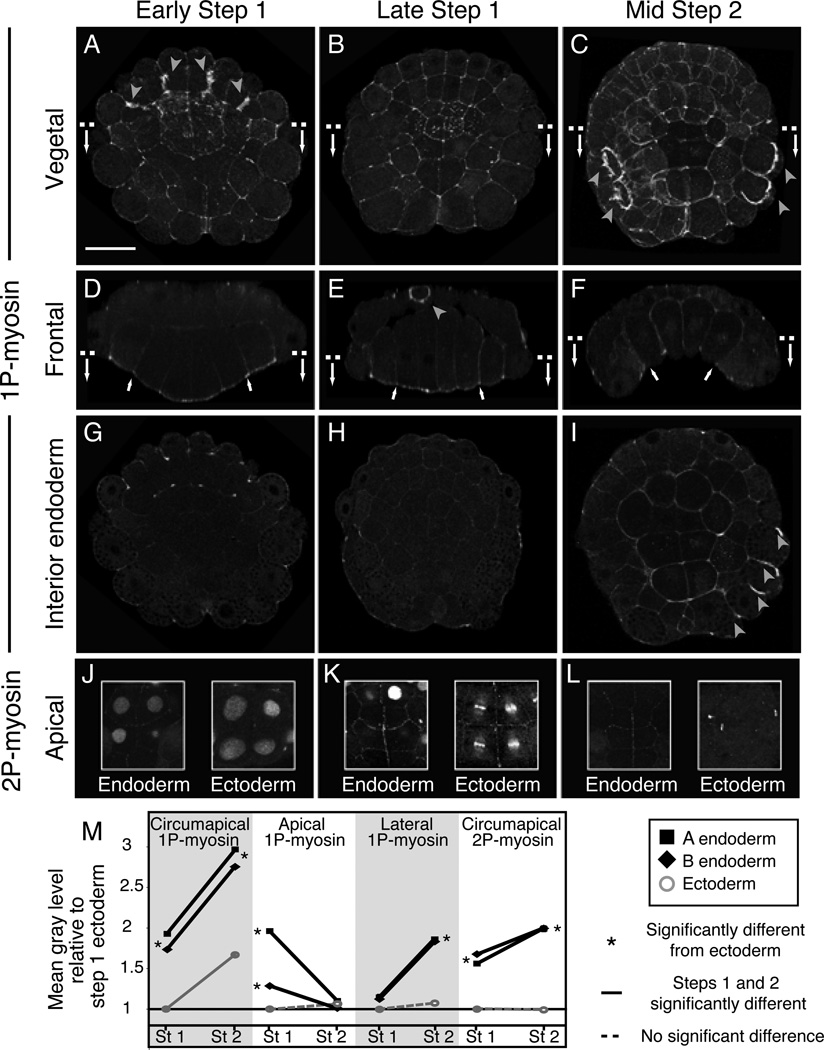
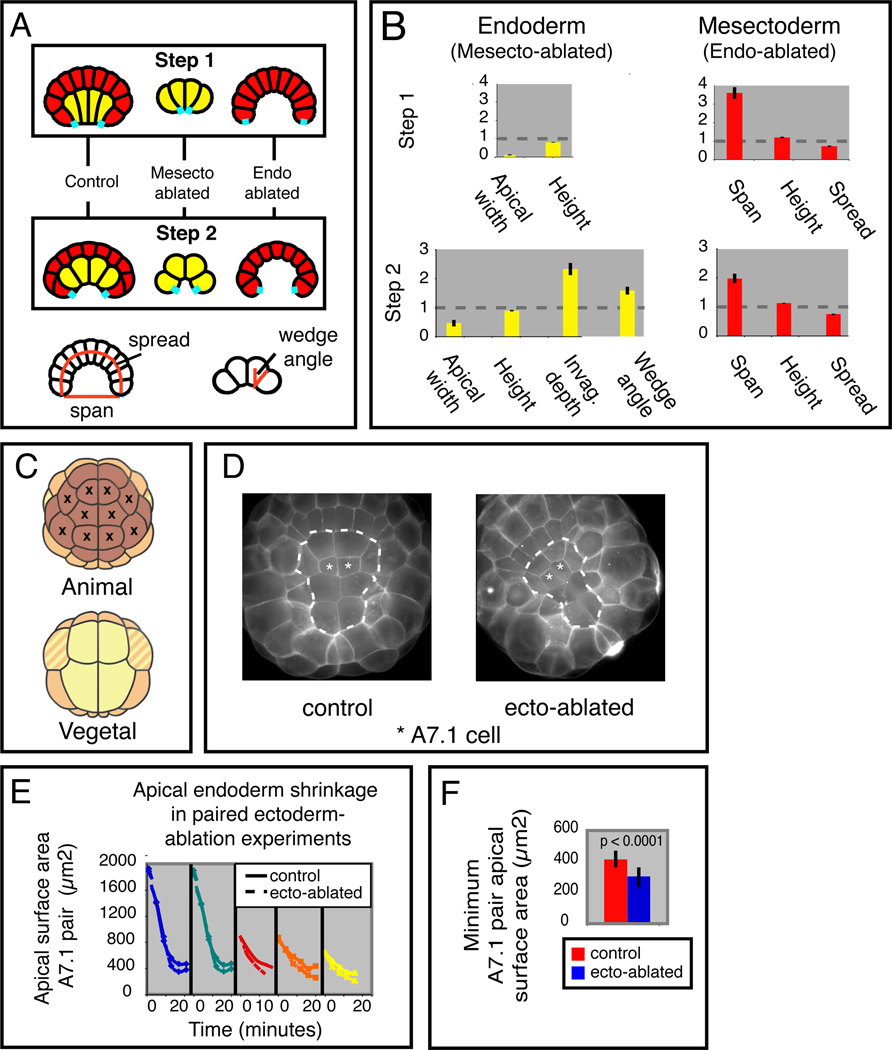
Results: We combined experimental and computational approaches to identify a two-step mechanism for endoderm invagination during ascidian gastrulation. During Step 1, which immediately precedes invagination, endoderm cells constrict their apices because of Rho/Rho-kinase-dependent apical enrichment of 1P-myosin. Our data suggest that endoderm invagination itself occurs during Step 2, without further apical shrinkage, via a novel mechanism we call collared rounding: Rho/Rho-kinase-independent basolateral enrichment of 1P-myosin drives apico-basal shortening, whereas Rho/Rho-kinase-dependent enrichment of 1P and 2P myosin in circumapical collars is required to prevent apical expansion and for deep invagination. Simulations show that boundary-specific tension values consistent with these distributions of active myosin can explain the cell shape changes observed during invagination both in normal embryos and in embryos treated with pharmacological inhibitors of either Rho-kinase or Myosin II ATPase. Indeed, we find that the balance of strong circumapical and basolateral tension is the only mechanism based on differential cortical tension that can explain ascidian endoderm invagination. Finally, simulations suggest that mesectoderm cells resist endoderm shape changes during both steps, and we confirm this prediction experimentally.

Conclusions: Our findings suggest that early ascidian gastrulation is driven by the coordinated apposition of circumapical and lateral endoderm contraction, working against a resisting mesectoderm. We propose that similar mechanisms may operate during other invaginations.


Figures

Figure 1
Figure 1. Ascidian invagination occurs in two highly conserved steps
A : Animal (top) and vegetal (bottom) views of Ciona embryos showing the positions of cell cleavages between the 64- and 76-cell (early Step1, left), 76- and early 112-cell (late Step, center) and early/late 112-cell (Step 2, right) stages. Lines link newly formed sister cell pairs. B-D : Sagittal, vegetal, and frontal views of 3D–reconstructed Ciona intestinalis (B), Phallusia mammillata (C) and Boltenia villosa (D, sagittal only) embryos at the indicated stages. Yellow = endoderm; orange = mesoderm; red = ectoderm. Supplementary Figure S1 shows interactive 3D views of reconstructed embryos.
Figure 2
Figure 2. Morphometric analysis of cell shape changes during invagination
A-I: Evolution of geometric characteristics in whole Ciona intestinalis embryos between the 64-and late 112-cell stages. Color scales indicate both magnitude and direction of changes (n = 3 embryos for 64- 76- and late 112-cell stages; n = 2 for early 112-cell stage). J, K: Measurements of apico-basal height (J) and apical surface area (K) for A7.1 (dashed yellow lines) and a7.16 (dashed red lines) cell pairs in reconstructed Phallusia embryos, imaged live every 5 minutes (each dashed line is an embryo) or fixed prior to imaging (solid lines, n = 7 embryos per data point; error bars are standard deviations). L, M: Measurements for the same cell pairs in fixed Ciona intestinalis embryos (n = 5 embryos per data point). See Figure S2 for additional data on cell volume change and maintenance of epithelial architecture during invagination. Movies S1 and S2 show time lapse sequences of invagination.
Figure 3
Figure 3. Patterns of phosphomyosin accumulation correlate with cell shape changes during invagination
A-I: Vegetal surface views (A-C), frontal sections (D-F), and horizontal sections (G-I) of Boltenia embryos showing 1P–myosin distribution at early and late Step 1 and mid Step 2. Dashed lines in A-C and D-F show positions of frontal and horizontal sections respectively. Gray arrowheads in A-C, I: accumulation of 1P–myosin in cleavage furrows. White arrows in D-F: lateral boundaries of endoderm plate. J-L: Circumapical 2P–myosin distributions on endoderm and ectoderm cells at early (J) and late (K) Step 1 and mid Step 2 (L). The cortical stain was confined to a narrow sub-apical region. Endoderm/ectoderm image pairs come from the same embryo. The antibody to 2P–myosin also labels nuclei and spindle midbodies as seen previously in other cell types [44]. See Movie S4 for 3D views of 2P–myosinM: Quantification of relative pixel intensities (Step 1 vs. Step 2; endoderm vs. ectoderm) for different boundaries from fixed, immunostained Boltenia embryos. Asterisks indicate significant differences (p < 0.05 for 1-tailed Mann-Whitney U-tests; p was usually < 0.0001) between endoderm and ectoderm. Similar results for Ciona are presented in Figure 4). See Movies S3 and S4 for 3D views of 1P and 2P myosin-stained embryos.
Figure 4
Figure 4. Different zones of localized contractility contribute to invagination inC. intestinalis
A-D: Cross-sectional views of embryos treated with 100µM Blebbistatin during Step 1 (B) or Step 2 (D), fixed at the end of each step and phalloidin-stained. A, C: Controls for Step 1 and Step 2. E-H: Apical surface area (E, G) and apico-basal height (F, H) at early Step1, late Step 1 and late Step 2 in embryos treated with 100µM Blebbistatin (E, F) or 100µM Y-27632 (G, H). Dashed lines link data points at the onset, intermediate time points and end of each treatment. Measurements for paired WT controls shown in solid yellow lines. Asterisks in E-H indicate significant differences (asterisks indicate p < 0.05 for 2-tailed t-test); error bars indicate standard deviations. Numbers of embryos measured were (Blebbistatin: n≥7 for all measurements; Y-27632: n = 4 and n = 5 for Step 2 control and Y-treated embryos, respectively, n ≥ 7 for all other measurements). Embryos in panels G,H and E,F were fixed at a slightly different times during late step 2. I-R: Phalloidin (K,L), 1P–myosin (I,J, M-P) and 2P–Myosin (Q,R) staining in controls and in embryos treated with 100 µM Y-27632 for 30 minutes and fixed at the end of Step 1 (I-L) or Step 2 (M-R). I-N: frontal sections. O, P: horizontal sections along the lines indicated in M,N. Q, R: blow-up of sub-apical horizontal sections across the vegetal pole. Arrows indicate lateral boundaries of the endoderm plate. S: Comparison of phosphomyosin levels on the indicated surfaces of A 7.1 cells in controls (solid black lines) and in embryos treated with 100 µM Y-27632 for 30 minutes prior to fixation at end of either Step 1 or Step 2 (light dashed lines). Figure S3 shows the effects on invagination of microtubule depolymerization and dominant-negative inhibition of RhoA. Movie S5 documents apical expansion during Step 2 in Y-treated embryos.
Figure 5
Figure 5. Simulations based on differential cortical tension support a two-step mechanism for endoderm invagination
A: A model embryo constructed from contractile/viscoelastic elements. Different boundary colors indicate boundary-specific tension values. B: Starting and sample end geometries. C: Criteria used to specify passing geometries for Step 1 and Step 2 simulations of “wild type” ascidian embryos. Symbols are represented on Panel B. D,E: Summary view of how final geometries attained by simulation from initial Step 1 (D) and Step 2 (E) geometries vary as a function of tension ratios. Colored embryos correspond to tension ratios lying nearest the clouds of passing parameter sets shown in F,G. F,G: Position in tension ratio space of successful solutions shown as projections along the Mesecto_L/A (F) or Endo_L/A (G) axes. Values vary logarithmically along both axes and the central color legend applies to both panels. See Supplementary Modeling Procedures for details. Movies S6 and S7 show examples of successful Step 1 and 2 simulations. Figure S4 shows distributions of absolute tensions for Step 1 and 2 parameter space searches, and the results of parameter space searches with: (a) boundary-specific internal viscosities and (b) unconstrained variation of basal tensions.
Figure 6
Figure 6. Effect on invagination of virtual and experimental ablations of endoderm or mesectoderm
A: Schematic overview of the results of virtual ablations of mesectoderm and endoderm. The cyan segments indicate reference points used for measurements in B. The bottom diagrams show how endoderm wedge angle, mesectoderm spread and mesectoderm span were measured. B: Quantification of morphological changes produced by simulated ablation of mesectoderm or endoderm during Step 1 or 2. The height of each bar represents the fractional change for the indicated morphological measure, relative to controls, averaged over 100 runs with different passing parameters. Error bars are standard deviations. Cell height, apical width and invagination depth were measured as in Figure 5B. C: Schematic view of a 32-cell embryo indicating the 10 laser-ablated ectoderm cells. D: Vegetal views of paired control (left) and ectoderm-ablated (right) embryos at late Step 1. Dashed lines mark the endoderm boundary (see Movie S1 for the corresponding time-lapse sequence). E: Evolution of apical A7.1 surface area over time during Step 1 for 5 separate pairs of control vs ectoderm-ablated embryos. F: Minimum apical endoderm surface area achieved during Step 1 in control and ectoderm-ablated embryos. Figure S5 shows additional comparisons of model simulations with experimental perturbations (cleavage arrest by nocodazole, Rho kinase inhibition by Y-27632 and myosin inhibition by blebbistatin).
Figure 7
Figure 7. Model for a two-step invagination of ascidian endoderm
red: 1P-myosin, light blue: 2P-myosin. Black arrows in Step 1 indicate mesectoderm resistance. Magenta arrows indicate apicobasal shortening and lateral spreading of mesectoderm (mechanism unknown), which may lower mesectoderm resistance.

References

    1. Davidson L, Koehl MAR, Keller R, Oster GF. How do sea urchins invaginate? Using biomechanics to distinguish between mechanisms of primary invagination. Development. 1995;121:2005–2018. - PubMed
    1. Keller , Davidson RL, Shook D. How we are shaped: The biomechanics of gastrulation. Differentiation. 2003;71:171–205. - PubMed
    1. Clausi DA, Brodland GW. Mechanical evaluation of theories of neurulation using computer simulations. Development. 1993;118:1013–1023.
    1. Jacobsen AG, Oster GF, Odell GM, Cheng LY. Neurulation and the cortical tractor model for epithelial folding. Journal of embryology and experimental morphology. 1986;96:19–49. - PubMed
    1. Muñoz JJ, Barrett K, Miodownik M. A deformation gradient decomposition method for the analysis of the mechanics of morphogenesis. Journal of Biomechanics. 2007;40:1372–1380. - PubMed

MeSH terms