

Dose-related gene expression changes in forebrain following acute, low-level chlorpyrifos exposure in neonatal rats
- PMID: 20691718
- PMCID: PMC2946483
- DOI: 10.1016/j.taap.2010.07.026
Dose-related gene expression changes in forebrain following acute, low-level chlorpyrifos exposure in neonatal rats
Abstract
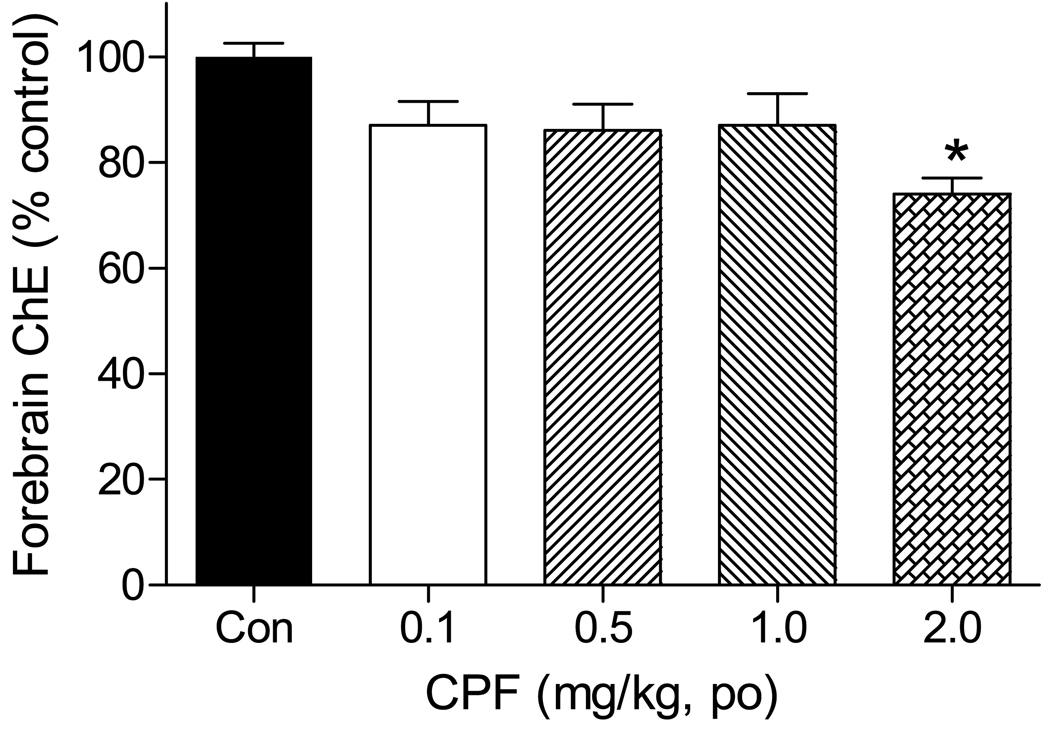
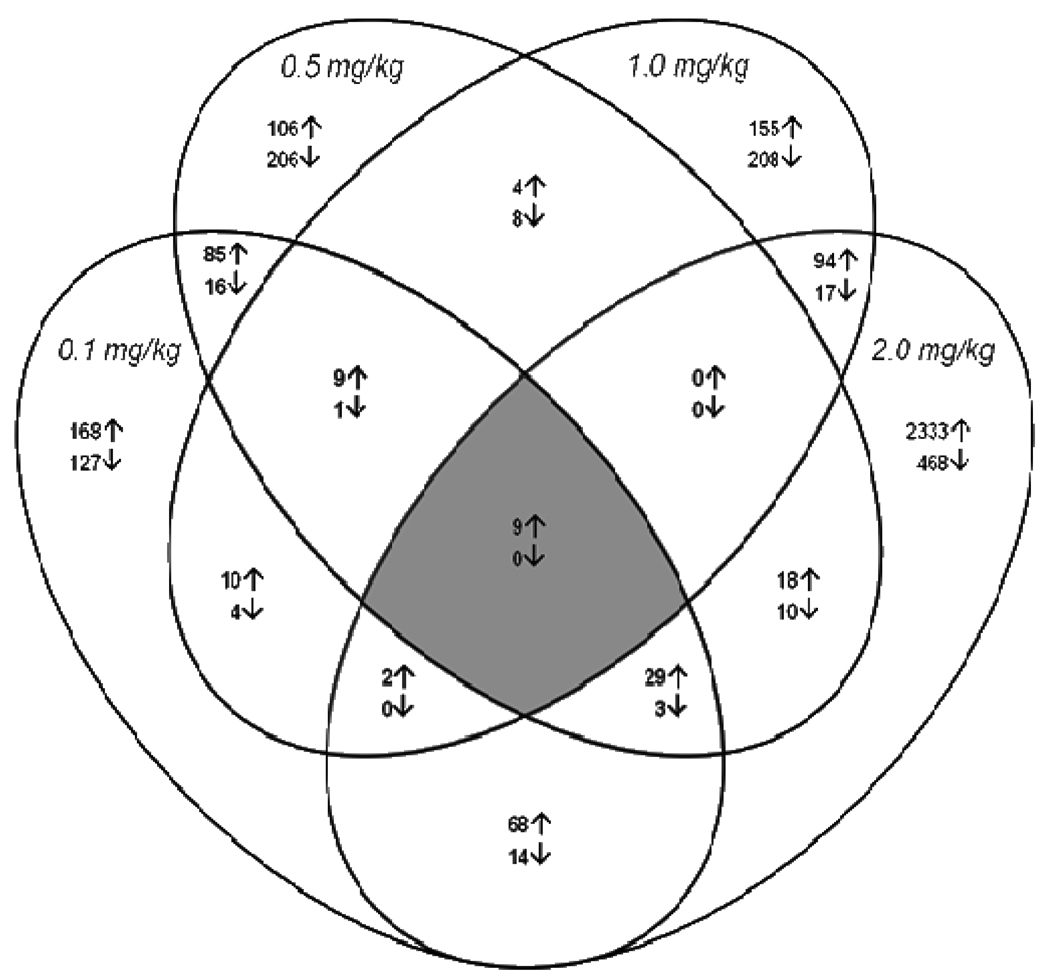
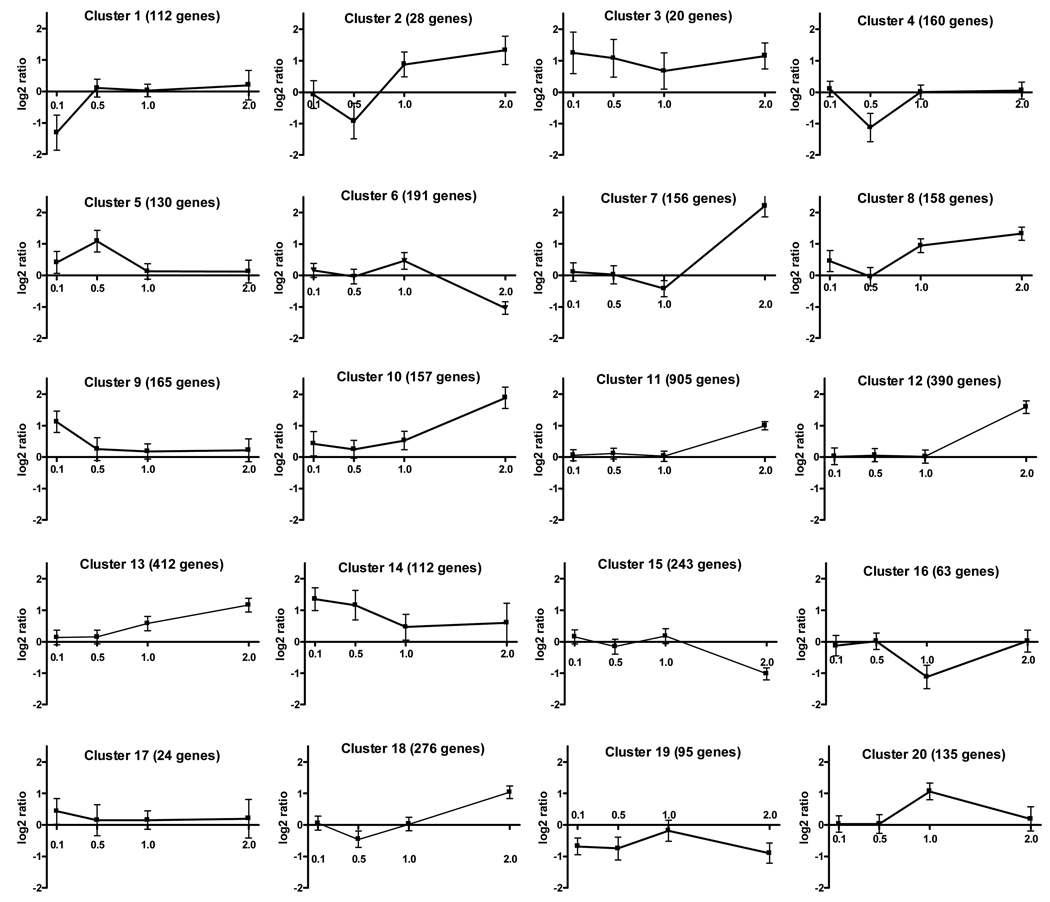
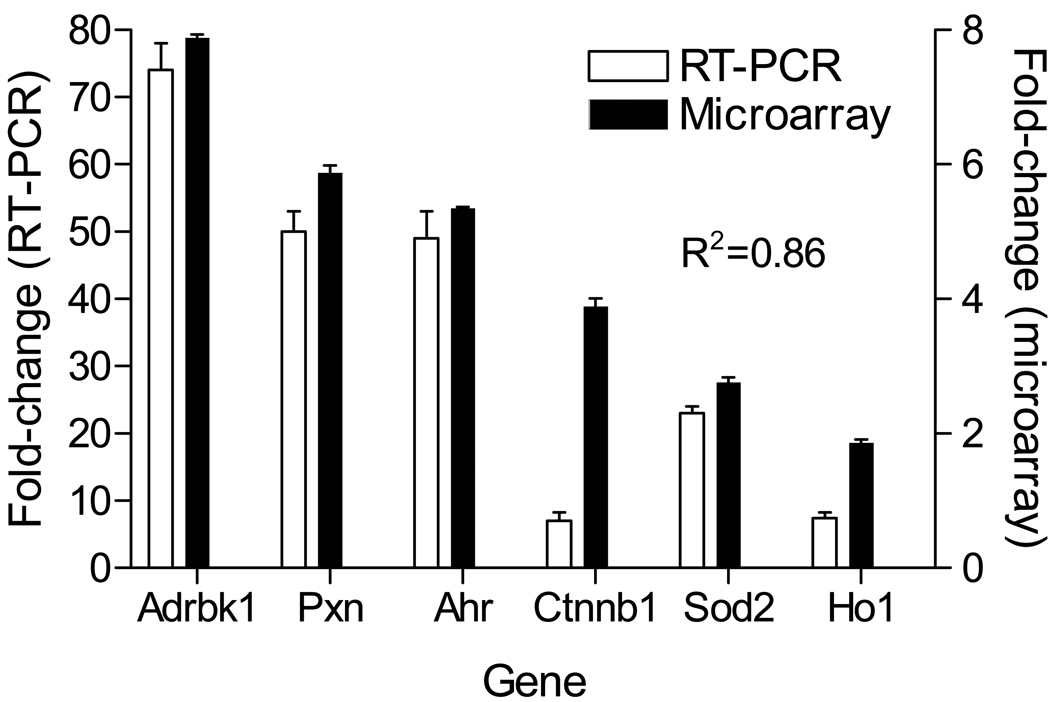
Chlorpyrifos (CPF) is a widely used organophosphorus insecticide (OP) and putative developmental neurotoxicant in humans. The acute toxicity of CPF is elicited by acetylcholinesterase (AChE) inhibition. We characterized dose-related (0.1, 0.5, 1 and 2mg/kg) gene expression profiles and changes in cell signaling pathways 24h following acute CPF exposure in 7-day-old rats. Microarray experiments indicated that approximately 9% of the 44,000 genes were differentially expressed following either one of the four CPF dosages studied (546, 505, 522, and 3,066 genes with 0.1, 0.5, 1.0 and 2.0mg/kg CPF). Genes were grouped according to dose-related expression patterns using K-means clustering while gene networks and canonical pathways were evaluated using Ingenuity Pathway Analysis®. Twenty clusters were identified and differential expression of selected genes was verified by RT-PCR. The four largest clusters (each containing from 276 to 905 genes) constituted over 50% of all differentially expressed genes and exhibited up-regulation following exposure to the highest dosage (2mg/kg CPF). The total number of gene networks affected by CPF also rose sharply with the highest dosage of CPF (18, 16, 18 and 50 with 0.1, 0.5, 1 and 2mg/kg CPF). Forebrain cholinesterase (ChE) activity was significantly reduced (26%) only in the highest dosage group. Based on magnitude of dose-related changes in differentially expressed genes, relative numbers of gene clusters and signaling networks affected, and forebrain ChE inhibition only at 2mg/kg CPF, we focused subsequent analyses on this treatment group. Six canonical pathways were identified that were significantly affected by 2mg/kg CPF (MAPK, oxidative stress, NFΚB, mitochondrial dysfunction, arylhydrocarbon receptor and adrenergic receptor signaling). Evaluation of different cellular functions of the differentially expressed genes suggested changes related to olfactory receptors, cell adhesion/migration, synapse/synaptic transmission and transcription/translation. Nine genes were differentially affected in all four CPF dosing groups. We conclude that the most robust, consistent changes in differential gene expression in neonatal forebrain across a range of acute CPF dosages occurred at an exposure level associated with the classical marker of OP toxicity, AChE inhibition. Disruption of multiple cellular pathways, in particular cell adhesion, may contribute to the developmental neurotoxicity potential of this pesticide.
Copyright © 2010 Elsevier Inc. All rights reserved.
Figures
Similar articles
-
Repeated exposure to neurotoxic levels of chlorpyrifos alters hippocampal expression of neurotrophins and neuropeptides.Toxicology. 2016 Jan 18;340:53-62. doi: 10.1016/j.tox.2016.01.001. Epub 2016 Jan 13. Toxicology. 2016. PMID: 26775027 Free PMC article.
-
In vivo interaction between chlorpyrifos and parathion in adult rats: sequence of administration can markedly influence toxic outcome.Toxicol Appl Pharmacol. 2001 Dec 15;177(3):247-55. doi: 10.1006/taap.2001.9312. Toxicol Appl Pharmacol. 2001. PMID: 11749124
-
Comparative cholinergic neurotoxicity of oral chlorpyrifos exposures in preweanling and adult rats.Toxicol Sci. 2000 May;55(1):124-32. doi: 10.1093/toxsci/55.1.124. Toxicol Sci. 2000. PMID: 10788567
-
The effect of chlorpyrifos and chlorpyrifos-oxon on brain cholinesterase, muscarinic receptor binding, and neurotrophin levels in rats following early postnatal exposure.Toxicol Sci. 2004 Jan;77(1):63-71. doi: 10.1093/toxsci/kfh003. Epub 2003 Nov 4. Toxicol Sci. 2004. PMID: 14600285
-
Nonenzymatic functions of acetylcholinesterase splice variants in the developmental neurotoxicity of organophosphates: chlorpyrifos, chlorpyrifos oxon, and diazinon.Environ Health Perspect. 2007 Jan;115(1):65-70. doi: 10.1289/ehp.9487. Environ Health Perspect. 2007. PMID: 17366821 Free PMC article.
Cited by
-
Concentration-dependent effects of chlorpyrifos oxon on peroxisome proliferator-activated receptor signaling in MCF-7 cells.Toxicol In Vitro. 2022 Feb;78:105268. doi: 10.1016/j.tiv.2021.105268. Epub 2021 Oct 29. Toxicol In Vitro. 2022. PMID: 34756920 Free PMC article.
-
Relationship between Prenatal or Postnatal Exposure to Pesticides and Obesity: A Systematic Review.Int J Environ Res Public Health. 2021 Jul 4;18(13):7170. doi: 10.3390/ijerph18137170. Int J Environ Res Public Health. 2021. PMID: 34281107 Free PMC article.
-
Effects of Chlorpyrifos or Methyl Parathion on Regional Cholinesterase Activity and Muscarinic Receptor Subtype Binding in Juvenile Rat Brain.J Toxicol Pharmacol. 2017;1:018. Epub 2017 Dec 30. J Toxicol Pharmacol. 2017. PMID: 30035273 Free PMC article.
-
Oxidative stress, unfolded protein response, and apoptosis in developmental toxicity.Int Rev Cell Mol Biol. 2015;317:1-66. doi: 10.1016/bs.ircmb.2015.02.002. Epub 2015 Mar 11. Int Rev Cell Mol Biol. 2015. PMID: 26008783 Free PMC article. Review.
-
Olfactory Transcriptional Analysis of Salmon Exposed to Mixtures of Chlorpyrifos and Malathion Reveal Novel Molecular Pathways of Neurobehavioral Injury.Toxicol Sci. 2016 Jan;149(1):145-57. doi: 10.1093/toxsci/kfv223. Epub 2015 Oct 22. Toxicol Sci. 2016. PMID: 26494550 Free PMC article.
References
-
- Aldridge JE, Seidler FJ, Slotkin TA. Developmental exposure to chlorpyrifos elicits sex-selective alterations of serotonergic synaptic function in adulthood: critical periods and regional selectivity for effects on the serotonin transporter, receptor subtypes, and cell signaling. Environ. Health Perspect. 2004;112:148–155. - PMC - PubMed
Publication types
MeSH terms
Substances
Grants and funding
LinkOut - more resources
Full Text Sources
Miscellaneous
