Distribution and neurochemical characterization of protein kinase C-theta and -delta in the rodent hypothalamus
- PMID: 20691763
- PMCID: PMC5203986
- DOI: 10.1016/j.neuroscience.2010.07.064
Distribution and neurochemical characterization of protein kinase C-theta and -delta in the rodent hypothalamus
Abstract
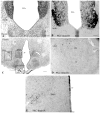
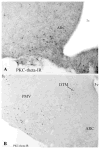
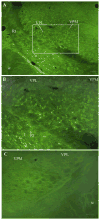
PKC-theta (PKC-θ), a member of the novel protein kinase C family (nPKC), regulates a wide variety of functions in the periphery. However, its presence and role in the CNS has remained largely unknown. Recently, we demonstrated the presence of PKC-θ in the arcuate hypothalamic nucleus (ARC) and knockdown of PKC-θ from the ARC protected mice from developing diet-induced obesity. Another isoform of the nPKC group, PKC-delta (PKC-δ), is expressed in several non-hypothalamic brain sites including the thalamus and hippocampus. Although PKC-δ has been implicated in regulating hypothalamic glucose homeostasis, its distribution in the hypothalamus has not previously been described. In the current study, we used immunohistochemistry to examine the distribution of PKC-θ and -δ immunoreactivity in rat and mouse hypothalamus. We found PKC-θ immunoreactive neurons in several hypothalamic nuclei including the ARC, lateral hypothalamic area, perifornical area and tuberomammillary nucleus. PKC-δ immunoreactive neurons were found in the paraventricular and supraoptic nuclei. Double-label immunohistochemisty in mice expressing green fluorescent protein either with the long form of leptin receptor (LepR-b) or in orexin (ORX) neurons indicated that PKC-θ is highly colocalized in lateral hypothalamic ORX neurons but not in lateral hypothalamic LepR-b neurons. Double-label immunohistochemistry in oxytocin-enhanced yellow fluorescent protein mice or arginine vasopressin-enhanced green fluorescent protein (AVP-EGFP) transgenic rats revealed a high degree of colocalization of PKC-δ within paraventricular and supraoptic oxytocin neurons but not the vasopressinergic neurons. We conclude that PKC-θ and -δ are expressed in different hypothalamic neuronal populations.
Copyright © 2010 IBRO. Published by Elsevier Ltd. All rights reserved.
Figures


Similar articles
-
Palmitic acid mediates hypothalamic insulin resistance by altering PKC-theta subcellular localization in rodents.J Clin Invest. 2009 Sep;119(9):2577-89. doi: 10.1172/JCI36714. Epub 2009 Aug 10. J Clin Invest. 2009. PMID: 19726875 Free PMC article.
-
Distribution and chemical composition of estrogen receptor β neurons in the paraventricular nucleus of the female and male mouse hypothalamus.J Comp Neurol. 2017 Dec 1;525(17):3666-3682. doi: 10.1002/cne.24295. Epub 2017 Aug 21. J Comp Neurol. 2017. PMID: 28758220 Free PMC article.
-
Differences in acid-induced currents between oxytocin-mRFP1 and vasopressin-eGFP neurons isolated from the supraoptic and paraventricular nuclei of transgenic rats.Neurosci Lett. 2014 Nov 7;583:1-5. doi: 10.1016/j.neulet.2014.09.004. Epub 2014 Sep 8. Neurosci Lett. 2014. PMID: 25220704
-
Histamine stimulates c-fos expression in hypothalamic vasopressin-, oxytocin-, and corticotropin-releasing hormone-containing neurons.Endocrinology. 1994 Jan;134(1):482-91. doi: 10.1210/endo.134.1.8275963. Endocrinology. 1994. PMID: 8275963
-
Estrogen modulates oxytocin gene expression in regions of the rat supraoptic and paraventricular nuclei that contain estrogen receptor-beta.Prog Brain Res. 2002;139:15-29. doi: 10.1016/s0079-6123(02)39004-6. Prog Brain Res. 2002. PMID: 12436923 Review.
Cited by
-
Oxytocin Transforms Firing Mode of CA2 Hippocampal Neurons.Neuron. 2018 Nov 7;100(3):593-608.e3. doi: 10.1016/j.neuron.2018.09.008. Epub 2018 Oct 4. Neuron. 2018. PMID: 30293821 Free PMC article.
-
Pituitary adenylate cyclase-activating polypeptide receptor activation in the hypothalamus recruits unique signaling pathways involved in energy homeostasis.Am J Physiol Endocrinol Metab. 2022 Mar 1;322(3):E199-E210. doi: 10.1152/ajpendo.00320.2021. Epub 2022 Jan 10. Am J Physiol Endocrinol Metab. 2022. PMID: 35001657 Free PMC article.
-
Brain GLP-1 signaling regulates femoral artery blood flow and insulin sensitivity through hypothalamic PKC-δ.Diabetes. 2011 Sep;60(9):2245-56. doi: 10.2337/db11-0464. Epub 2011 Aug 1. Diabetes. 2011. PMID: 21810595 Free PMC article.
-
Oxytocin enhances observational fear in mice.Nat Commun. 2017 Dec 13;8(1):2102. doi: 10.1038/s41467-017-02279-5. Nat Commun. 2017. PMID: 29235461 Free PMC article.
-
Oxytocin, Neural Plasticity, and Social Behavior.Annu Rev Neurosci. 2021 Jul 8;44:359-381. doi: 10.1146/annurev-neuro-102320-102847. Epub 2021 Apr 6. Annu Rev Neurosci. 2021. PMID: 33823654 Free PMC article. Review.
References
-
- Alaluf S, Mulvihill ER, McIlhinney RA. Rapid agonist mediated phosphorylation of the metabotropic glutamate receptor 1 alpha by protein kinase C in permanently transfected BHK cells. FEBS Lett. 1995;367:301–305. - PubMed
-
- Anand BK, Brobeck JR. Localization of a “feeding center” in the hypothalamus of the rat. Proc Soc Exp Biol Med. 1951;77:323–324. - PubMed
-
- Anand BK, Chhina GS, Sharma KN, Dua S, Singh B. Activity of single neurons in the hypothalamic feeding centers: effect of glucose. Am J Physiol. 1964;207:1146–1154. - PubMed
-
- Balthasar N, Dalgaard LT, Lee CE, Yu J, Funahashi H, Williams T, Ferreira M, Tang V, McGovern RA, Kenny CD, Christiansen LM, Edelstein E, Choi B, Boss O, Aschkenasi C, Zhang CY, Mountjoy K, Kishi T, Elmquist JK, Lowell BB. Divergence of melanocortin pathways in the control of food intake and energy expenditure. Cell. 2005;123:493–505. - PubMed
Publication types
MeSH terms
Substances
Grants and funding
LinkOut - more resources
Full Text Sources
Molecular Biology Databases
Miscellaneous

