

Detecting novel genes with sparse arrays
- PMID: 20691772
- PMCID: PMC4175568
- DOI: 10.1016/j.gene.2010.07.009
Detecting novel genes with sparse arrays
Abstract
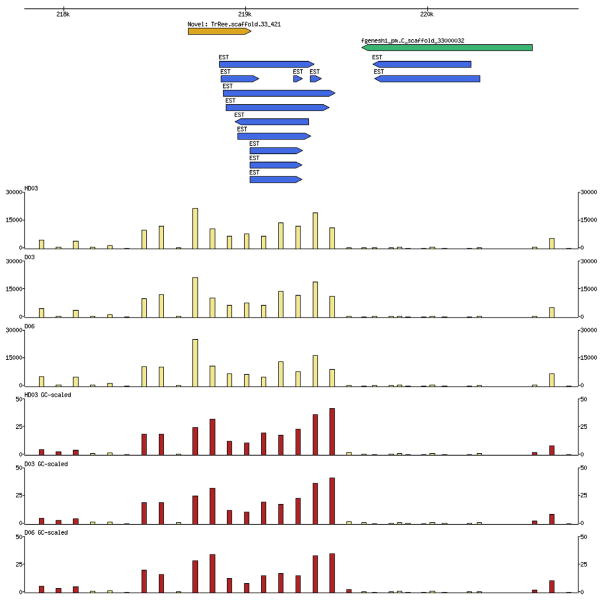
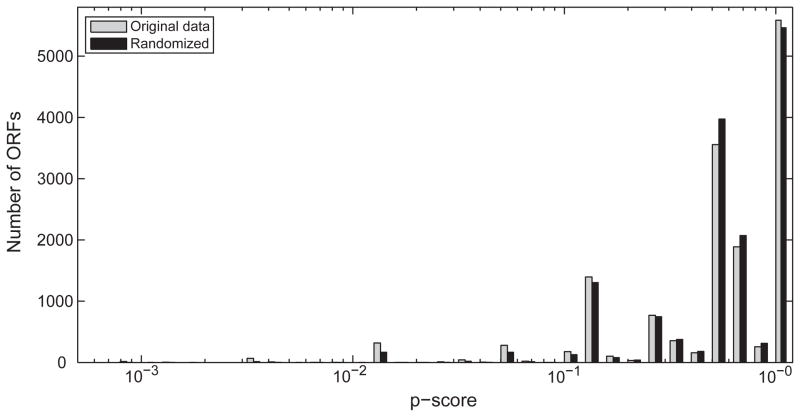
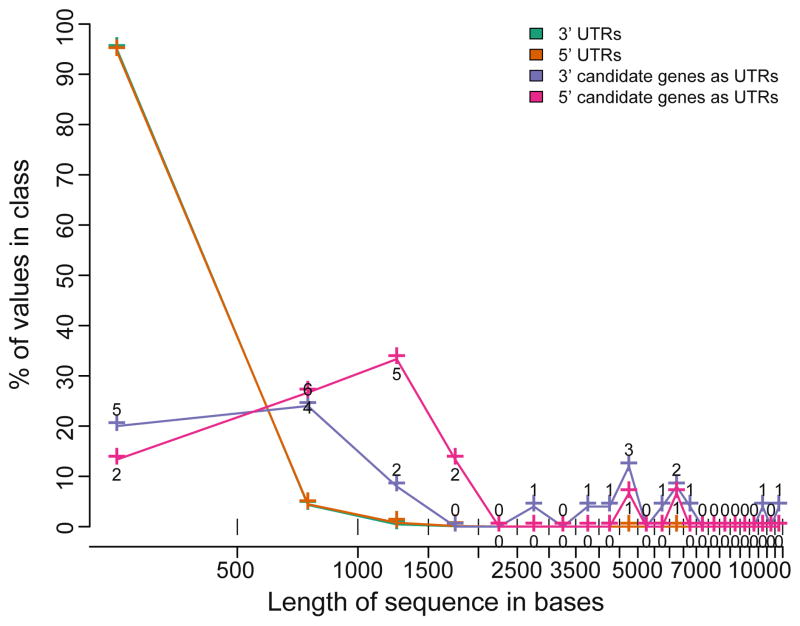
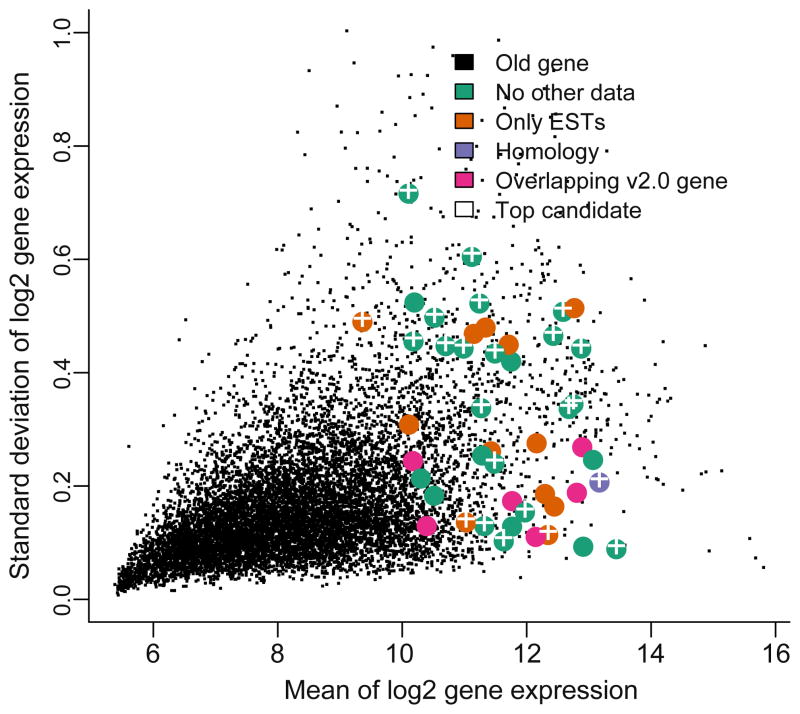
Species-specific genes play an important role in defining the phenotype of an organism. However, current gene prediction methods can only efficiently find genes that share features such as sequence similarity or general sequence characteristics with previously known genes. Novel sequencing methods and tiling arrays can be used to find genes without prior information and they have demonstrated that novel genes can still be found from extensively studied model organisms. Unfortunately, these methods are expensive and thus are not easily applicable, e.g., to finding genes that are expressed only in very specific conditions. We demonstrate a method for finding novel genes with sparse arrays, applying it on the 33.9 Mb genome of the filamentous fungus Trichoderma reesei. Our computational method does not require normalisations between arrays and it takes into account the multiple-testing problem typical for analysis of microarray data. In contrast to tiling arrays, that use overlapping probes, only one 25 mer microarray oligonucleotide probe was used for every 100b. Thus, only relatively little space on a microarray slide was required to cover the intergenic regions of a genome. The analysis was done as a by-product of a conventional microarray experiment with no additional costs. We found at least 23 good candidates for novel transcripts that could code for proteins and all of which were expressed at high levels. Candidate genes were found to neighbour ire1 and cre1 and many other regulatory genes. Our simple, low-cost method can easily be applied to finding novel species-specific genes without prior knowledge of their sequence properties.
Copyright © 2010 Elsevier B.V. All rights reserved.
Figures
Similar articles
-
Efficient oligonucleotide probe selection for pan-genomic tiling arrays.BMC Bioinformatics. 2009 Sep 16;10:293. doi: 10.1186/1471-2105-10-293. BMC Bioinformatics. 2009. PMID: 19758451 Free PMC article.
-
Genome-wide transcriptome analysis in yeast using high-density tiling arrays.Methods Mol Biol. 2011;759:107-23. doi: 10.1007/978-1-61779-173-4_7. Methods Mol Biol. 2011. PMID: 21863484
-
Defining the genome-wide role of CRE1 during carbon catabolite repression in Trichoderma reesei using RNA-Seq analysis.Fungal Genet Biol. 2014 Dec;73:93-103. doi: 10.1016/j.fgb.2014.10.009. Epub 2014 Oct 18. Fungal Genet Biol. 2014. PMID: 25459535
-
In-depth query of large genomes using tiling arrays.Methods Mol Biol. 2007;377:163-74. doi: 10.1007/978-1-59745-390-5_10. Methods Mol Biol. 2007. PMID: 17634616 Review.
-
Dark matter in the genome: evidence of widespread transcription detected by microarray tiling experiments.Trends Genet. 2005 Feb;21(2):93-102. doi: 10.1016/j.tig.2004.12.009. Trends Genet. 2005. PMID: 15661355 Review.
Cited by
-
A versatile toolkit for high throughput functional genomics with Trichoderma reesei.Biotechnol Biofuels. 2012 Jan 2;5(1):1. doi: 10.1186/1754-6834-5-1. Biotechnol Biofuels. 2012. PMID: 22212435 Free PMC article.
-
Kinetic transcriptome analysis reveals an essentially intact induction system in a cellulase hyper-producer Trichoderma reesei strain.Biotechnol Biofuels. 2014 Dec 12;7(1):173. doi: 10.1186/s13068-014-0173-z. eCollection 2014. Biotechnol Biofuels. 2014. PMID: 25550711 Free PMC article.
-
Systems biological approaches towards understanding cellulase production by Trichoderma reesei.J Biotechnol. 2013 Jan 20;163(2):133-42. doi: 10.1016/j.jbiotec.2012.05.020. Epub 2012 Jun 29. J Biotechnol. 2013. PMID: 22750088 Free PMC article. Review.
-
Correlation of gene expression and protein production rate - a system wide study.BMC Genomics. 2011 Dec 20;12:616. doi: 10.1186/1471-2164-12-616. BMC Genomics. 2011. PMID: 22185473 Free PMC article.
-
Multi-scale genetic dynamic modelling I : an algorithm to compute generators.Theory Biosci. 2011 Sep;130(3):165-82. doi: 10.1007/s12064-011-0125-0. Epub 2011 Apr 13. Theory Biosci. 2011. PMID: 21487823
References
Publication types
MeSH terms
Substances
Grants and funding
LinkOut - more resources
Full Text Sources
Molecular Biology Databases
Miscellaneous
