Reference values and Z-scores for subregional femorotibial cartilage thickness--results from a large population-based sample (Framingham) and comparison with the non-exposed Osteoarthritis Initiative reference cohort
- PMID: 20691798
- PMCID: PMC2982217
- DOI: 10.1016/j.joca.2010.07.010
Reference values and Z-scores for subregional femorotibial cartilage thickness--results from a large population-based sample (Framingham) and comparison with the non-exposed Osteoarthritis Initiative reference cohort
Abstract
Objective: To establish sex-specific (subregional) reference values of cartilage thickness and potential maximal Z-scores in the femorotibial joint.
Methods: The mean cartilage thickness (ThCtAB.Me) in femorotibial compartments, plates and subregions was determined on coronal magnetic resonance imaging (MRI) from a population-based sample (Framingham) and from a healthy reference sample of the Osteoarthritis Initiative (OAI).
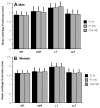
Results: 686 Framingham participants (309 men, 377 women, age 62 ± 8 years) had no radiographic femorotibial osteoarthritis (OA) ("normals") and 376 (156 men, 220 women) additionally had no MRI features of cartilage lesions ("supernormals"). The Framingham "normals" had thinner cartilage in the medial (3.59 mm) than in the lateral femorotibial compartment (3.86 mm). Medially, the femur displayed thicker cartilage (1.86 mm) than the tibia (1.73 mm), and laterally the tibia thicker cartilage (2.09 mm) than the femur (1.77 mm). The thickest cartilage was observed in central, and the thinnest in external femorotibial subregions. Potential maximal Z-scores ranged from 5.6 to 9.8 throughout the subregions; men displayed thicker cartilage but similar potential maximal Z-scores as women. Mean values and potential maximal Z-scores in Framingham "supernormals" and non-exposed OAI reference participants (112 participants without symptoms or risk factors of knee OA) were similar to Framingham "normals".
Conclusions: We provide reference values and potential maximal Z-scores of cartilage thickness in middle aged to elderly non-diseased populations without radiographic OA. Results were similar for "supernormal" participants without MRI features of cartilage lesions, and in a cohort without OA symptoms or risk factors. A cartilage thickness loss of around 27% is required for attaining a Z-score of -2.
Copyright © 2010 Osteoarthritis Research Society International. Published by Elsevier Ltd. All rights reserved.
Conflict of interest statement
Felix Eckstein is CEO and co-owner of Chondrometrics GmbH. He provides consulting services to MerckSerono, Pfizer, Wyeth and Novartis.
Mei Yang has no competing interests.
Ali Guermazi is CEO and co-owner of Boston Imaging Core Lab, LLC (BICL) and owns stocks/or stock options in Synarc. He provides consulting services to MerckSerono, Stryker and Facet Solutions.
Frank Roemer and co-owner of Boston Imaging Core Lab, LLC (BICL).
Kristen Picha has a full time employment with Centocor R&D, Inc.
Frédéric Baribaud has a full time employment with Centocor R&D, Inc.
Martin Hudelmaier has a part time employment with Chondrometrics GmbH.
Wolfgang Wirth has a part time employment with Chondrometrics GmbH.
David Felson has no competing interests.
Figures


References
-
- Guermazi A, Burstein D, Conaghan P, Eckstein F, Hellio Le Graverand-Gastineau MP, Keen H, et al. Imaging in osteoarthritis. Rheum Dis Clin North Am. 2008;34:645–87. - PubMed
-
- Eckstein F, Mosher T, Hunter D. Imaging of knee osteoarthritis: data beyond the beauty. Curr Opin Rheumatol. 2007;19:435–43. - PubMed
-
- Eckstein F, Burstein D, Link TM. Quantitative MRI of cartilage and bone: degenerative changes in osteoarthritis. NMR Biomed. 2006;19:822–54. - PubMed
-
- Eckstein F, Ateshian G, Burgkart R, Burstein D, Cicuttini F, Dardzinski B, et al. Proposal for a nomenclature for magnetic resonance imaging based measures of articular cartilage in osteoarthritis. Osteoarthritis Cartilage. 2006;14:974–83. - PubMed
-
- Eckstein F, Cicuttini F, Raynauld JP, Waterton JC, Peterfy C. Magnetic resonance imaging (MRI) of articular cartilage in knee osteoarthritis (OA): morphological assessment. Osteoarthritis Cartilage. 2006;14(Suppl 1):46–75. - PubMed
Publication types
MeSH terms
Grants and funding
LinkOut - more resources
Full Text Sources

