. 2010 Aug 6;142(3):433-43.
doi: 10.1016/j.cell.2010.07.012.

Insights into antiparallel microtubule crosslinking by PRC1, a conserved nonmotor microtubule binding protein

Affiliations

Insights into antiparallel microtubule crosslinking by PRC1, a conserved nonmotor microtubule binding protein

Radhika Subramanian et al. Cell. .

Abstract

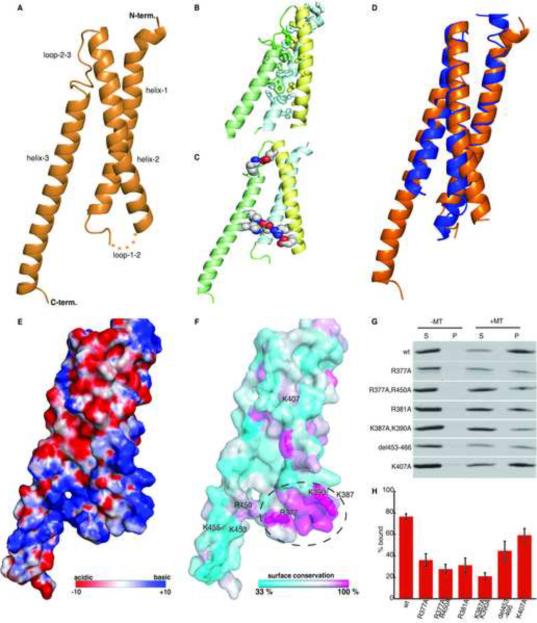
Formation of microtubule architectures, required for cell shape maintenance in yeast, directional cell expansion in plants and cytokinesis in eukaryotes, depends on antiparallel microtubule crosslinking by the conserved MAP65 protein family. Here, we combine structural and single molecule fluorescence methods to examine how PRC1, the human MAP65, crosslinks antiparallel microtubules. We find that PRC1's microtubule binding is mediated by a structured domain with a spectrin-fold and an unstructured Lys/Arg-rich domain. These two domains, at each end of a homodimer, are connected by a linkage that is flexible on single microtubules, but forms well-defined crossbridges between antiparallel filaments. Further, we show that PRC1 crosslinks are compliant and do not substantially resist filament sliding by motor proteins in vitro. Together, our data show how MAP65s, by combining structural flexibility and rigidity, tune microtubule associations to establish crosslinks that selectively "mark" antiparallel overlap in dynamic cytoskeletal networks.


Figures

FIGURE 1
FIGURE 1
Single molecule analysis of microtubule binding by PRC1. (A) Schematic of PRC1's domain organization and a guide for constructs used in the fluorescence microscopy assays (purple: coiled-coil domain; green: microtubule binding domain; black: C-terminal domain). (B) Fluorescence intensity analysis of two PRC1 constructs, GFP-PRC1-FL (aa: 1–620; intensity =2.5×10⁴ ± 0.9×10⁴, N = 469) and GFP-PRC1-NS (aa: 1–466; intensity =2.0×10⁴ ± 0.8×10⁴, N = 156). Dimeric-Eg5-GFP (Intensity = 2.5×10⁴ ± 1.0×10⁴, N = 377) and tetrameric-Eg5-GFP (Intensity = 4.2×10⁴ ± 2.2×10⁴, N = 290) were used as references. (C–H) Single molecule TIRF assay was used to examine the association of PRC1 constructs (green) with microtubules (orange) immobilized on a glass surface. (C) Schematic for assay showing the two constructs, GFP-PRC1-FL and GFP-PRC1-NSΔC (aa.1–486). Single frames showing two-color overlays (top) and associated kymographs (below) of GFP-PRC1-FL (D,E) or GFP-PRC1-NSΔC (F,G). (H) Distribution of microtubule association lifetimes for GFP-PRC1-FL (blue) and GFP-PRC1-NSΔC (red). (I–K) Microtubule association of GFP-PRC1-NSΔC under different ionic strength conditions. Representative kymographs from assays at 0.75× motility buffer (I), motility buffer (J), motility buffer+20 mM KCl. (K) Scale bars: 1.5 μm, 10 s. See also Figures S1 and S3
FIGURE 2
FIGURE 2
Microtubule co-sedimentation assays to determine equilibrium dissociation constants for PRC1's microtubule binding domains. (A) Schematic for constructs used in this assay: PRC1-S (aa: 341–466) and PRC1-SC (aa: 341–620). SDS-PAGE analysis of co-sedimentation assays for PRC1-SC (B) and PRC1-S (C). Arrows in (B) indicate C-terminus proteolysis products in PRC1-SC. Bands marked with red boxes in (B) indicate the relative tubulin concentration at which 50% of the different PRC1-SC truncation products co-sediment with microtubules. (D) Band intensities from the gels in (C) were used to determine fraction protein bound, and plotted against microtubule concentration (n=3, mean ± SD). The data were fit to a modified Hill equation to determine Kd's (PRC1-S: 3.3 ± 1.8 μM; PRC1-SC: 0.6 ± 0.3 μM).
FIGURE 3
FIGURE 3
PRC1's conserved microtubule binding domain (PRC1-S; aa: 341–466) adopts a spectrin fold. (A) Ribbon diagram shows the overall structure. Five disordered residues in the loop between helix-1 and 2 are indicated by dots. (B) Hydrophobic residues from helix-1 (cyan), helix-2 (yellow) and helix-3 (green), which form the core of the triple helix bundle, are highlighted (sticks). (C) Salt bridges between charged residues from helix-1 (cyan), helix-2 (yellow) and helix-3 (green) are indicated (spheres). (D) Overlay of PRC1's spectrin domain (orange) with its closest structural homolog, which is a spectrin repeat in Plactin (blue, PDB = 2odu-A, Z-score = 7.7, rmsd = 3.4 Å calculated using DALI). (E) Surface representation showing electrostatic potential of the spectrin domain in PRC1 (Red to blue is −10 kbT to +10 kbT, as calculated using APBS). (F) Residues with low (cyan), intermediate (white), and high (magenta) conservation on the surface of the PRC1's spectrin domain. The labeled residues were selected for mutagenesis studies. (G) SDS-PAGE analysis of microtubule co-sedimentation assays of PRC1-S mutants at 27 μM tubulin. (H) Band intensities from (C) were quantified to determine the fraction of PRC1 bound to microtubules (n=3, error bars indicate SE). See also Figure S2
FIGURE 4
FIGURE 4
The spectrin domain fits into the Cryo-EM density map of the PRC1-microtubule complex with an optimal orientation. (A) Schematic comparing full-length PRC1 to the construct PRC1-NSΔC (aa: 1–486) used for Cryo-EM analysis. (B) Surface rendered side-view of 3D EM density map of the microtubule-PRC1-NSΔC complex. (C) Top view of cryo-EM density map of undecorated tubulin (gold) superimposed with the microtubule-PRC1-NSΔC complex (purple mesh). (D) Side- and (E) top-view of the crystal structure (cyan ribbon diagram) docked into the PRC1 density (purple mesh) protruding from an α/β tubulin dimer (gold). Residues R377 and K387, which are involved in microtubule binding, are indicated in red and black respectively. Microtubule polarity indicated in (B) was determined by comparison with a 3D EM structure of a dynein-microtubule complex, which has a well defined polarity (Carter et al., 2008). See also Figure S4
FIGURE 5
FIGURE 5
The dimerization domain in PRC1 is ordered when crosslinking two microtubules. (A) Schematic highlights the section viewed in the cryotomographic reconstructions shown in (B) and (C), which encompasses the two microtubules and the PRC1 crosslinks. (B–C) Slice through cryotomographic 3-D reconstruction of microtubules crosslinked by PRC1-NSΔC. Slices represent the central area of the microtubules and the bound PRC1-NSΔC. The top and bottom of the microtubules are excluded in these views. Examples of microtubule pairs with dense (B) and sparse (C) PRC1 occupancy. Insets show 4-fold enlargements of the crosslinks between microtubules. Red arrows highlight individual cross-bridges. Blue arrow in (B) indicates a PRC1 molecule that does not form crosslinks with another microtubule. Long red arrows in (B) indicate the polarity of microtubules, portions of which are highlighted in blue for clarity. The top two microtubules in (B) share PRC1 crossbridges as do the bottom two microtubules, however, the middle two microtubules are separated by another microtubule (dotted blue line) that is positioned below the plane and only the top of its tubulin lattice can be observed.
FIGURE 6
FIGURE 6
PRC1 crosslinks do not substantially resist the relative sliding of two microtubules by kinesin-5. (A) Schematic illustrating the assay used to examine the effect of PRC1 (green) on kinesin-5 (cyan)-mediated relative sliding of two microtubules (orange), when extent of overlap between microtubules is unchanged. Near-simultaneous dual-mode microscopy was used to image microtubules (via wide-field fluorescent speckle microscopy) and GFP-PRC1-FL (via Total Internal Reflection Fluorescence (TIRF) microscopy). (B) Frames from a time-lapse sequence (1 min interval) show GFP-PRC1-FL (green) enriched at regions where two crosslinked microtubules (red) overlap. (C) Corresponding kymograph shows the surface-attached static microtubule (vertical streaks) and a moving microtubule (diagonal streaks, 16.5 nm/s). (D) Kymograph shows that the GFP-PRC1-FL decorated region moves at the velocity of the moving microtubule. (E) Schematic illustrating the assay when overlap between microtubules decreases during relative microtubule sliding. (F) Frames from a time-lapse sequence (2 min interval) and corresponding kymographs showing microtubule movement (7 nm/s) (G) and GFP-PRC1-FL localization to overlap region that reduces due to relative sliding of filaments (H). (I) Velocity distributions for kinesin-5 driven microtubule sliding at 1.8 nM kinesin-5 and 0.034 (V = 23.1 ± 6.3 nm/s, N = 43), 0.14 nM (V = 17.7 ± 3.5 nm/s, N = 39), and 0.54 nM GFP-PRC1-FL (V = 9.7 ± 3.1 nm/s, N = 41). Scale bars: 1.5 μm, 100 s. See also Figure S5
FIGURE 7
FIGURE 7
PRC1 is a compliant, microtubule-overlap tracking protein that tunes structural rigidity to specifically crosslink two anti-parallel microtubules. (A) A model for how PRC1 can align microtubules into anti-parallel arrays. The spectrin domain in PRC1 can make oriented contacts with the microtubule to decode filament polarity. The unstructured domain acts to enhance the binding affinity, while allowing diffusion along microtubules. The dimerization domain is not entirely rigid on a single microtubule but adopts a specific conformation when crosslinking two microtubules. (B) The rigidity and flexibility of the different domains in PRC1 can facilitate sorting of randomly oriented microtubules into anti-parallel arrays and allow PRC1 to function as a selective `mark' for microtubule overlap regions.

Comment in

References

    1. Akhmanova A, Steinmetz MO. Tracking the ends: a dynamic protein network controls the fate of microtubule tips. Nat Rev Mol Cell Biol. 2008;9:309–322. - PubMed
    1. Amos LA, Schlieper D. Microtubules and maps. Adv Protein Chem. 2005;71:257–298. - PubMed
    1. Carter AP, Garbarino JE, Wilson-Kubalek EM, Shipley WE, Cho C, Milligan RA, Vale RD, Gibbons IR. Structure and functional role of dynein's microtubule-binding domain. Science. 2008;322:1691–1695. - PMC - PubMed
    1. Chan J, Jensen CG, Jensen LC, Bush M, Lloyd CW. The 65-kDa carrot microtubule-associated protein forms regularly arranged filamentous cross-bridges between microtubules. Proc Natl Acad Sci U S A. 1999;96:14931–14936. - PMC - PubMed
    1. Ciferri C, Pasqualato S, Screpanti E, Varetti G, Santaguida S, Dos Reis G, Maiolica A, Polka J, De Luca JG, De Wulf P, et al. Implications for kinetochore-microtubule attachment from the structure of an engineered Ndc80 complex. Cell. 2008;133:427–439. - PMC - PubMed

Publication types