. 2010 Oct 15;346(2):284-95.
doi: 10.1016/j.ydbio.2010.07.036. Epub 2010 Aug 6.

Concomitant requirement for Notch and Jak/Stat signaling during neuro-epithelial differentiation in the Drosophila optic lobe

Affiliations

Concomitant requirement for Notch and Jak/Stat signaling during neuro-epithelial differentiation in the Drosophila optic lobe

Kathy T Ngo et al. Dev Biol. .

Abstract

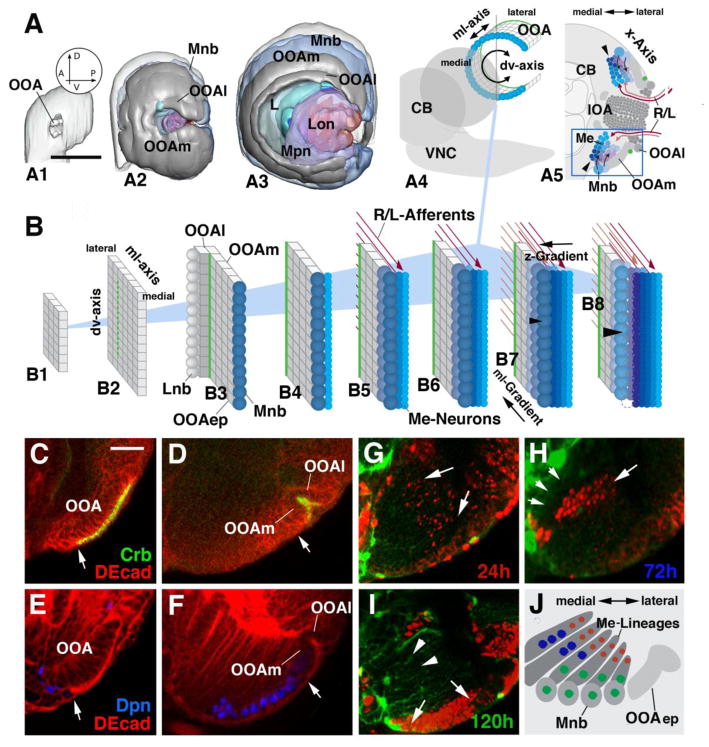
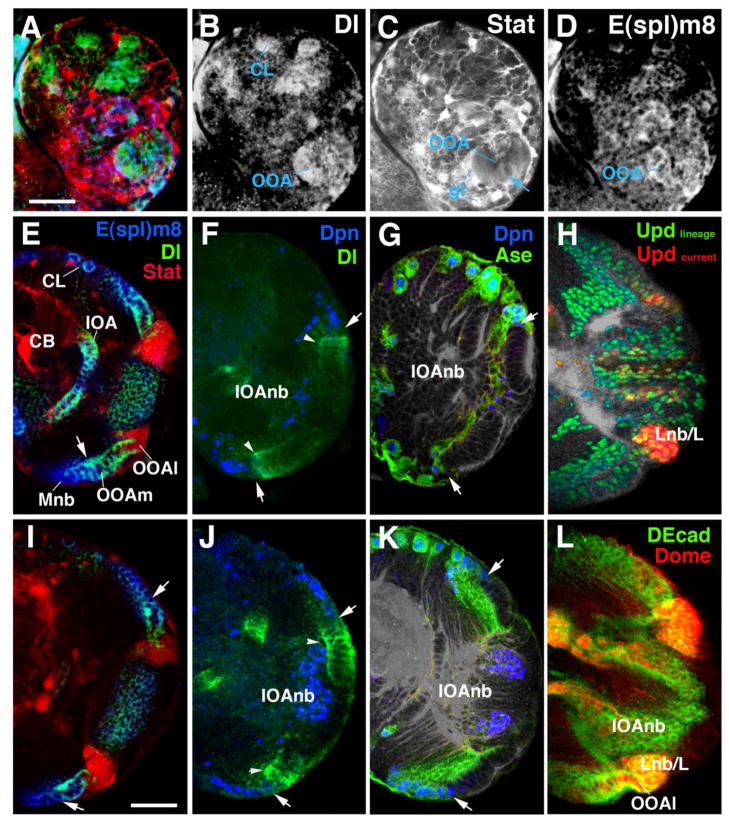
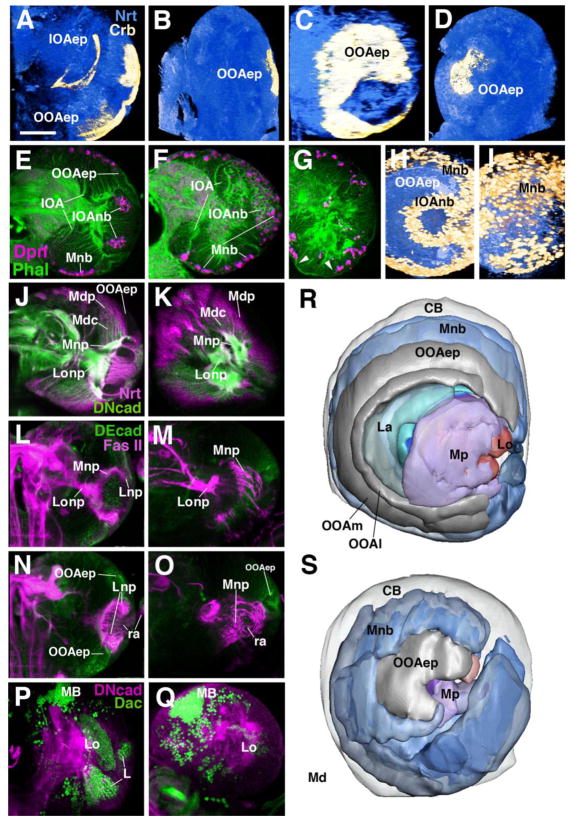
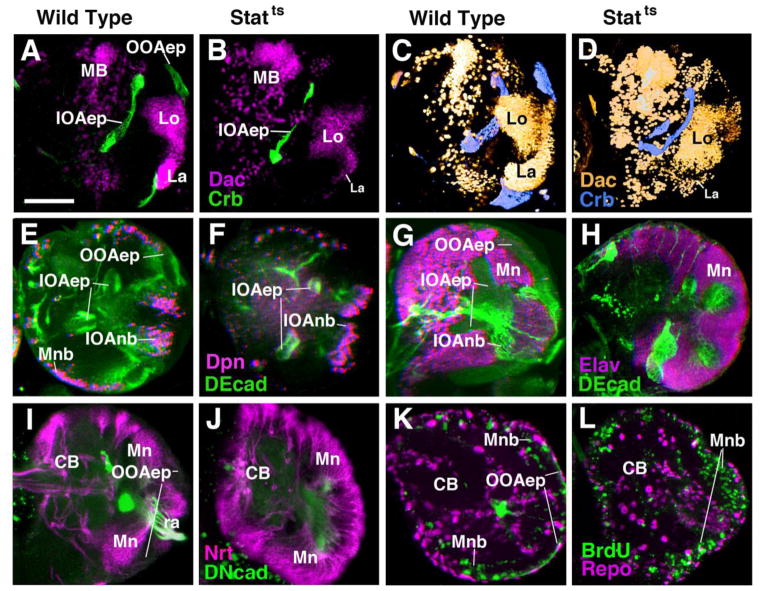
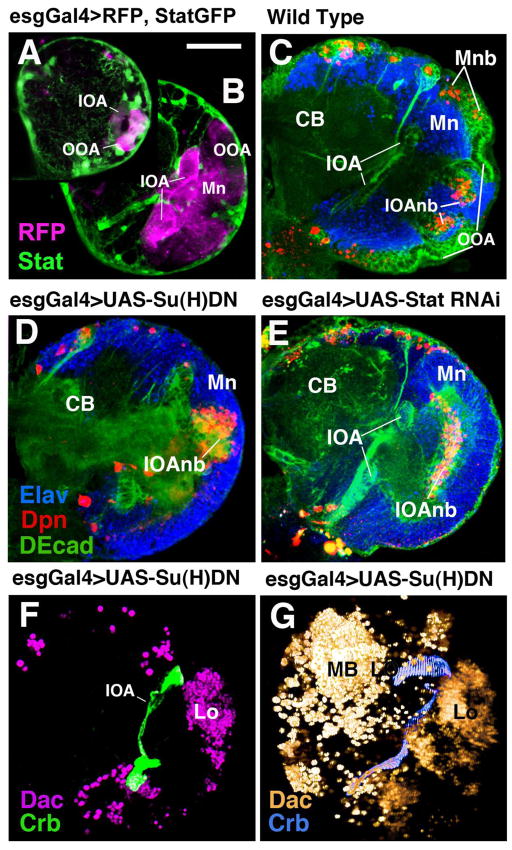
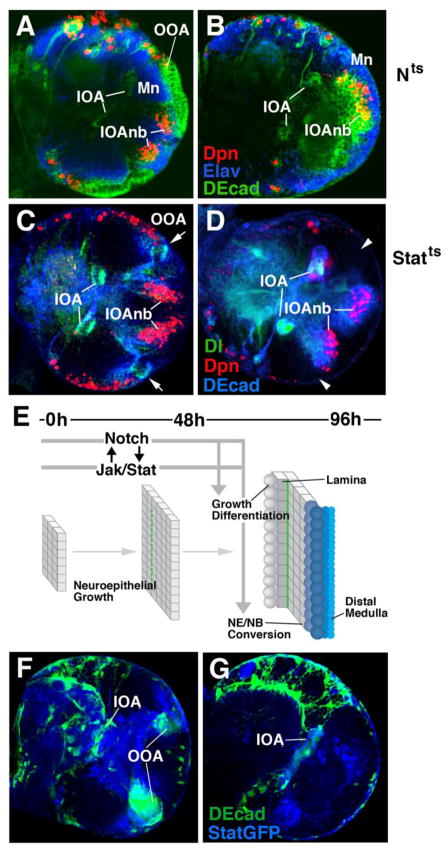
The optic lobe forms a prominent compartment of the Drosophila adult brain that processes visual input from the compound eye. Neurons of the optic lobe are produced during the larval period from two neuroepithelial layers called the outer and inner optic anlage (OOA, IOA). In the early larva, the optic anlagen grow as epithelia by symmetric cell division. Subsequently, neuroepithelial cells (NE) convert into neuroblasts (NB) in a tightly regulated spatio-temporal progression that starts at the edges of the epithelia and gradually move towards its centers. Neuroblasts divide at a much faster pace in an asymmetric mode, producing lineages of neurons that populate the different parts of the optic lobe. In this paper we have reconstructed the complex morphogenesis of the optic lobe during the larval period, and established a role for the Notch and Jak/Stat signaling pathways during the NE-NB conversion. After an early phase of complete overlap in the OOA, signaling activities sort out such that Jak/Stat is active in the lateral OOA which gives rise to the lamina, and Notch remains in the medial cells that form the medulla. During the third instar, a wave front of enhanced Notch activity progressing over the OOA from medial to lateral controls the gradual NE-NB conversion. Neuroepithelial cells at the medial edge of the OOA, shortly prior to becoming neuroblasts, express high levels of Delta, which activates the Notch pathway and thereby maintains the OOA in an epithelial state. Loss of Notch signaling, as well as Jak/Stat signaling, results in a premature NE-NB conversion of the OOA, which in turn has severe effects on optic lobe patterning. Our findings present the Drosophila optic lobe as a useful model to analyze the key signaling mechanisms controlling transitions of progenitor cells from symmetric (growth) to asymmetric (differentiative) divisions.


Figures

Figure 1
Figure 1
Topology of the developing optic lobe in the larva. (A1–A3) Digital 3D models of larval optic lobe in lateral view. Orientation is indicated by arrows in circular inset in A1 (A, anterior; P, posterior; D, dorsal; V, ventral). (A1) First instar (12h); (A2) Early third instar (72h); (A3) Late third instar (120h). Parts of the optic lobe, in these models and models of subsequent figures, are shown in different colors: light gray, outer optic anlage (OOA); dark gray, inner optic anlage (IOA); cyan, lamina neuroblasts and lamina neurons; dull blue, neuroblasts forming from outer optic anlage (distal medulla neuroblasts); bright blue, distal medulla neurons; magenta, neuroblasts forming from inner optic anlage; purple, neurons of proximal medulla (Mpn); red, neurons of lobula complex (Lon). (A3–A5): Schematic depiction of OOA relative to larval brain (CB: central brain; VNC: ventral nerve cord). The OOA is curved along the dorso-ventral axis (A4), so that a frontal section (A5; plane of sectioning indicated by gray line in A4) cuts through the OOA twice. (B1–B8): Schematic depiction of the outer optic anlage (OOA) at different larval stages (B1: early first instar; B8: late third instar). The OOA forms a rectangular epithelial layer appended to the lateral surface of the brain. For clarity sake, the OOA epithelium (OOAep) is depicted as a flat layer. The boundary between lateral OOA (OOAl) and medial OOA (OOAm) is shown as a green line. Medulla neuroblasts (Mnb) arising at the medial edge of the OOAm (B3–B8) are colored dull blue. Neuroblasts formed early (B3) are in darker shade, later neuroblasts (B5, B7) in lighter shade. Neuroblasts divide perpendicular to the plane of the epithelium (B4–B8) and give rise to the neurons of the distal medulla (Me-neurons), depicted in shades of bright blue. Neurons born first (B4) are in light blue; those born later are in increasingly dark shades of blue (B6, B8). Afferent axons from the retina and lamina (R/L-Afferents) are symbolized by red arrows (early arriving afferents, dark red; later afferents, light red). (C–F) Expression of markers for epithelial optic anlage (anti-Crb) and neuroblasts (anti-Dpn) in early third instar larva (C, E) and late third instar larva (D, F). Only ventral arm of the OOA is shown (see boxed area in panel A5). White arrows point at area of transition from epithelium (to the right of arrow) to neuroblast (to the left of arrow). OOA, outer optic anlage; OOAl, lateral domain of outer optic anlage; OOAm, medial domain of outer optic anlage. (G–J): BrdU pulse-chase experiments addressing pattern of proliferation in the OOAm. Panels show part of cross section of late third instar brain (120h after hatching) including OOAm, neuroblasts derived from it (Mnb), and columnar lineages of medulla neurons (Me-neurons) proliferated from the neuroblasts. The arrangement of these elements is schematically depicted in panel J. BrdU-positive cells are labelled by antibody (red); green signal corresponds to glia expressing GFP driven by Nrv2-Gal4. In panel G, a BrdU pulse was given between 0 and 24h after hatching; H: 48–72h; I: 96–120h. Scale bars: 40μm (A1–A3); 10μm (C–I)
Figure 2
Figure 2
Fatemap of the late larval optic lobe. (A) Confocal cross-section of late larval optic lobe of left brain hemisphere, labelled with anti-Neurotactin (white). Epithelial inner and outer optic anlagen (IOAep; magenta line; OOAep, blue line) are only faintly positive for anti-Neurotactin and appear dark. Neuroblasts arising from the outer optic anlage (Lnb, cyan circles; Mnb, blue circles) and inner optic anlage (IOAnb, magenta circles) are moderately strongly labelled; neurons and outgrowing axons are strongly labelled. Arrows on hatched lines indicate direction in which neurons are given off by their respective neuroblasts. Neurons of the distal medulla (Md) form discrete lineages, each one emitting a bundle of axons towards centrally (arrow). Tips of these axons gather in a plexus that forms the forerunner of the distal medulla neuropile (Mdnp, shaded blue). Lineages located medially belong to neuroblasts formed from the OOAm first (l1); the further lateral a lineage is located (ln), the later the corresponding neuroblast was formed. In each given lineage, neurons born early are located centrally, far from the surface (nc); late born neurons are peripherally (np). Neuroblasts of the IOA give off neurons outwardly (purple arrows) and inwardly (red arrows). The former makes up the proximal medulla (Mp) and the latter makes up the lobula and lobula plate (Lo; see also digital models in panel E). Axons of both of these neuron populations grow medially and form the proximal medulla neuropile (Mpnp, shaded in purple), the lobula plate neuropile (Lpnp, red) and the lobula neuropile (Lonp, pink). (B, C) Confocal cross-sections of late larval brain (B) and adult brain (C), labelled with anti-DNcadherin to visualize optic neuropiles (white). Left hemisphere, lateral to the left, dorsal up. Optic lobe neuropiles of the larva and adult are rendered in corresponding colors; abbreviations and color code as in A. Bars: 40μm
Figure 3
Figure 3
Spatio-temporal pattern of Notch and Jak/Stat signalling activity in the larval optic lobe. (A–D) Confocal section of first instar brain hemisphere showing outer optic anlage (OOA) and central brain (CB). In this and all other panels, lateral is to the right, dorsal is up. Expression levels of Delta (Notch ligand, in green in panel A) and E(spl)m8 (read-out of Notch signalling activity; blue in A) are strong throughout the OOA and central brain lineages (CL). Stat92EGFP (reporter of Jak/Stat signalling; red in A) is expressed most strongly in glia (gl) surrounding neurons and OOA, but appears at moderate level throughout the OOA as well (arrow in C). (E–G) Confocal section of brain hemisphere of early third instar (72h after hatching). (H–L) Sections of late third instar (96–120h after hatching). High levels of Jak/Stat activity (E, I; red color) become restricted to the lateral rim of the OOA (OOAl), which will give rise to the lamina. Delta expression is found throughout the epithelial OOA (E, F, I, J; green color); it is highest at the medial margin of the OOA where the NE-NB conversion takes place (arrowheads in F, J). High levels of E(spl)m8 are seen in the OOAm and the medulla neuroblasts Mnb) derived from it (E, I; blue color). A lacZ reporter for the proneural gene asense (ase) is expressed right behind (medial of) the Delta peak, overlapping with the neuroblast marker Deadpan (G, K). In panels F–K, the line of NE-NB conversion is indicated by white arrow. (H) Confocal section of third instar brain hemisphere showing expression of the G-TRACE construct driven by upd-Gal4. At this stage, upd-Gal4 drives dsRed-Stinger (shown in red) in the OOAl. Widespread expression of GFP in the OOA and most of its derivatives (green) demonstrates that upd-Gal4, at an earlier stage, was expressed in the entire OOA. (L): Expression of the receptor Domeless (Dome), using dome-gal4>GFP (in red) in outer optic anlage, with peak levels in OOAl and lamina primordium (Lnb/L). Other abbreviations: CB, central brain; CL, lineage of central brain; IOA, inner optic anlage; IOAnb, neuroblasts derived from inner optic anlage. Bars: 20μm (A–D); 30μm (E–L)
Figure 4
Figure 4
Loss of Notch signalling causes a premature NE-NB conversion and leads to structural defects in the optic lobe. Photographic panels (A–Q) are volume renderings (A–D; H–I) or frontal confocal sections (all others) of late third instar brain hemispheres labelled with different markers. Panels of left column (A, E, J, L, N, P) and panels C and H show wild-type control; panels of middle column (B, F, K, M, O, Q) and panels D and I are from Nts1 larvae raised at the restrictive temperature from first to third instar. (A–D) Abrogation of Notch signalling results in loss of the OOA epithelium, labelled with anti-Crumbs (Crb) antibody (yellow). Brain neurons are labelled with anti-Neurotactin (Nrt; blue) for reference. (E–K) Neuroblasts and neurons of the medulla, marked by anti-Deadpan (Dpn, E–I) or anti-Nrt (J, K) cover the entire lateral surface of the optic lobe. This phenotype is most clearly visible in volume renderings shown in lateral view (H, I). In wild-type (H), Dpn-positive medulla neuroblasts (Mnb), shown in yellow color, occupy a C-shaped band medial (in this view: “peripheral”) of the epithelial outer optic anlage (OOAep); Dpn-positive neuroblasts derived from the inner optic anlage (IOAnb) form a central cylinder. In Nts1 (I), the OOAep has converted prematurely to medulla neuroblasts (Mnb). Mdp, proximal medulla neurons; Mdc, central medulla neurons. (L–O) Double labelling with anti-Fasciclin II (FasII, magenta) to mark fiber tracts and anti-DE Cadherin (DEcad, green) to mark the epithelium of the OOA. Panels L and M show a plane of section through the center of the optic lobe neuropile; N and O show the optic lobe neuropile at an anterior plane. Most retinal afferents (ra) terminate in the lamina neuropile in wild-type (Lnp in L and N). In mutant, retinal afferents project in irregular tangles of fibers to the deeper medulla neuropile (Mnp in M and O). Note strongly decreased optic lobe epithelium (OOAep) in mutant. (P, Q) Loss of lamina neurons in Nts1 mutants. Double-labelling with anti-DN cadherin (green, neuropile marker) and anti-Dachshund [Dac, magenta; labels neurons of lamina (L), as well as lobula (Lo) and mushroom body (MB)]. (R, S) Digital 3D models of late third-instar larval brain hemisphere of wild-type (R) and Nts1 mutants (S). Models are shown in lateral view, anterior is to the left, dorsal is up. Models represent a view of the optic lobe surface, which is formed by the epithelial outer optic anlage (OOAep) and, more medially, the medulla neuroblasts (Mnb) derived from it. Laterally, and surrounded by the OOA, is the primordium of the Lamina (La), proximal medulla (Mp) and lobula complex (Lo). Color code as in model shown in Fig. 2. Other abbreviations: CB, central brain; OOAl, lateral domain of outer optic anlage; OOAm, medial domain of outer optic anlage. Bar: 50μm
Figure 5
Figure 5
Requirement of Stat signalling during optic lobe development. All panels except C and D show frontal confocal sections of late third instar brain hemispheres; medial is to the left, dorsal is up. C and D are volume renderings of brain hemispheres, antero-lateral view, lateral to the right. Panels of first column (A, E, I) and third column (C, G, K) show wild-type controls; panels of second column (B, F, J) and fourth column (D, H, L) are from Stat92EF/Stat92E85C9 larva raised at the restrictive temperature from first to third instar. (A–D) Labelling with anti-Crumbs (Crb, green in sections A and B; blue in volume renderings C and D) visualizes loss of epithelial outer optic anlage (OOAep) in mutant. By contrast, Crb-positive inner optic anlage (IOAep) is present, although deformed. Second label represents Dachshund (Dac) expressed in lamina (La) and lobula complex (Lo) in wild type; labelling of lamina is greatly reduced in mutant. (E, F) Labeling with anti-DEcad (green) and anti-Deadpan (Dpn, magenta). (G, H) Labeling with anti-DEcad (green) and anti-Elav (magenta; neuronal marker). Note that epithelial outer optic anlage (OOAep in E) and characteristic zone of medulla neuroblasts (Mnb in E) is absent in mutant (F). Entire lateral optic lobe is covered by Elav-positive medulla neurons (Mn in H). (I, J) Labeling with anti-Neurotactin (Nrt; magenta) illustrates loss of OOAep and overabundance of irregularly shaped clusters of medulla neurons (Mn). (K, L) Pulse of BrdU applied to late third instar brains results in increase in BrdU-labeled cells (medulla neuroblasts, Mnb) covering the entire periphery of the optic lobe in Stat92EF/Stat92E85C9. Bar: 50μm
Figure 6
Figure 6
Optic lobe-directed expression of mutant constructs using the esg-Gal4 driver line. (A, B): Frontal confocal sections of first instar (A) and early third instar (B) brain showing RFP expression, driven by esg-Gal4, in optic lobe (magenta). Stat92EGFP is labeled in green. (C) Frontal confocal section of third instar wild-type brain labeled with anti-DEcad (green), anti-Elav (blue), and anti-Deadpan (red). CB, central brain; IOA, inner optic anlage; IOAnb, neuroblasts of inner optic anlage; Mn, medulla neurons; Mnb, medulla neuroblasts; OOA, outer optic anlage. (D, E): Frontal confocal sections of late third instar brain in which a dominant-negative Su(H) construct [Su(H)DN] (D) or Stat92E-RNAi construct (E) under UAS control was driven by esg-Gal4. Note loss of epithelial outer optic anlage and premature growth of medullary neurons. (F, G) Labeling with anti-Dachshund (Dac) illustrates strong reduction of lamina primordium (La) in confocal section (F) and volume rendering (G). MB, mushroom body (central brain). Bar: 40μm
Figure 7
Figure 7
Temporal requirement of Notch and Stat signaling in optic lobe development. (A–D) Frontal confocal sections of late third instar brains (equivalent of 96h at 25°C) mutant for Nts (A, B) and Statts (C, D). In panels of the left, larvae were raised at the restrictive temperature from hatching until 48h later; in right panels, larvae grew at the restrictive temperature between 48h and 96h. (E) Timeline and schematic depiction of Notch/Stat function in optic lobe development. Despite their expression from early larval stages onward, Notch and Stat activity are only indispensable during the second half of the larval period, coinciding with the NE-NB conversion of the OOA. Thus, only late heat treatment caused noticeable abnormal phenotype, consisting of loss of epithelial OOA (arrowheads in D) and superficial position of medulla neurons (Mn in A, B). Peak expression of Delta, seen in narrow band along fringe of IOA and OOA in wild type or early heat-treated Stat-ts mutant (C; arrows) is only found in the IOA in late heat-treated Stat-ts (D), suggesting a requirement of Stat activity for maintaining high Dl levels. Conversely, as shown in panels F and G, persistent Notch activity is required to maintain Stat in the OOA (F: wild-type expression of Stat92EGFP reporter; G: Stat92EGFP reporter in optic lobe where Notch activity was inhibited by an esgGal4> Su(H)DN). Bar: 40mm

Similar articles

Cited by

References

    1. Ashburner M. Drosophila, a laboratory manual. New York: Cold Springs Harbor Laboratory Press; 1989.
    1. Artavanis-Tsakonas S, Simpson P. Choosing a cell fate: a view from the Notch locus. Trends Genet. 1991;7:403–408. - PubMed
    1. Assa-Kunik E, Torres IL, Schejter ED, Johnston DS, Shilo BZ. Drosophila follicle cells are patternedby multiple levels of Notch signaling and antagonism between Notch and JAK/STAT pathways. Development. 2007;134:1161–1169. - PubMed
    1. Austin CP, Feldman DE, Ida JA, Jr, Cepko CL. Vertebrate retinal ganglion cells are selected from competent progenitors by the action of Notch. Development. 1995;121:3637–3650. - PubMed
    1. Bach EA, Ekas L, Ayala-Camargo A, Flaherty MS, Lee H, Perrimon N, Baeg GH. GFP reporters detect the activation of the Drosophila JAK/STAT pathway in vivo. Gene Expr Patterns. 2007;7:323–331. - PubMed

Publication types

MeSH terms

LinkOut - more resources