Comparative Study
. 2010 Nov 15;49(9):1406-16.
doi: 10.1016/j.freeradbiomed.2010.07.026. Epub 2010 Aug 6.

Chronic alcohol-induced liver injury and oxidant stress are decreased in cytochrome P4502E1 knockout mice and restored in humanized cytochrome P4502E1 knock-in mice

Affiliations
Comparative Study

Chronic alcohol-induced liver injury and oxidant stress are decreased in cytochrome P4502E1 knockout mice and restored in humanized cytochrome P4502E1 knock-in mice

Yongke Lu et al. Free Radic Biol Med. .

Abstract

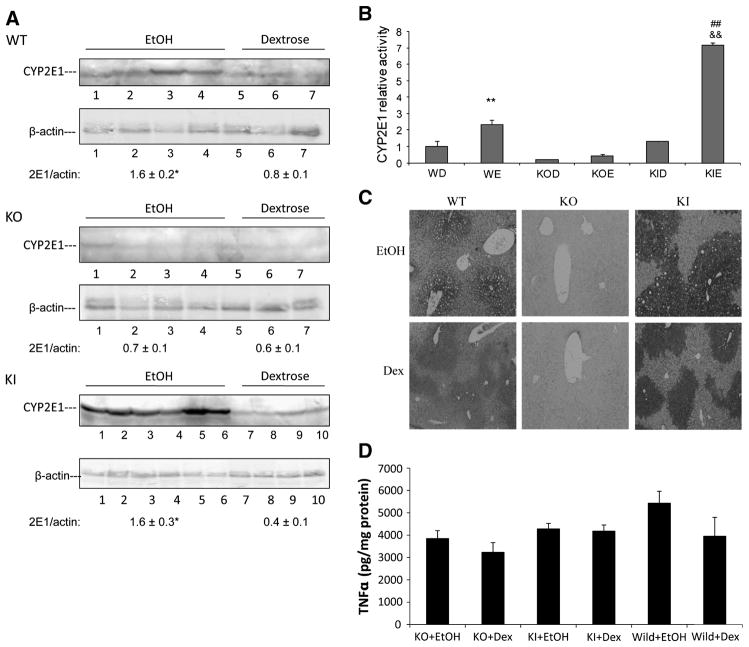
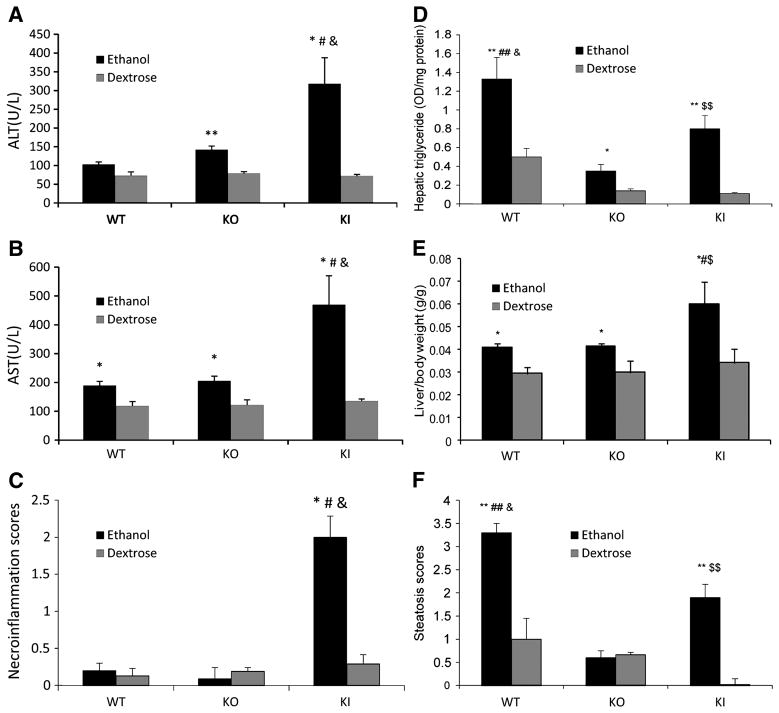
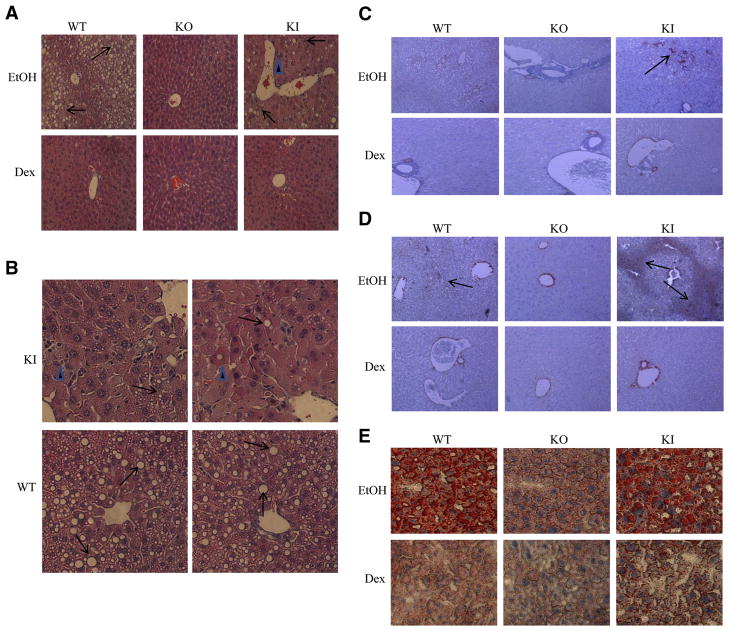
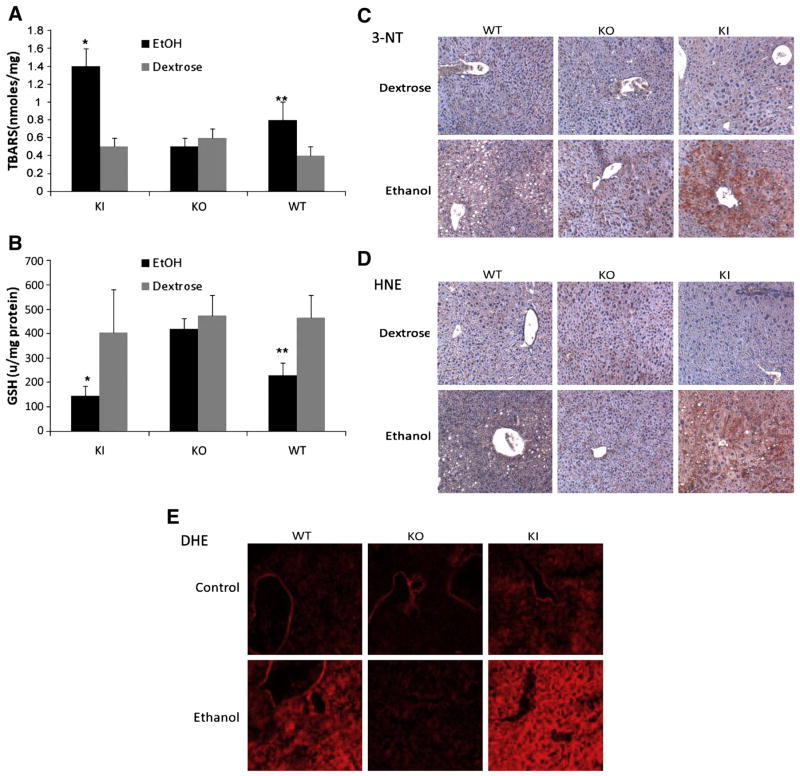
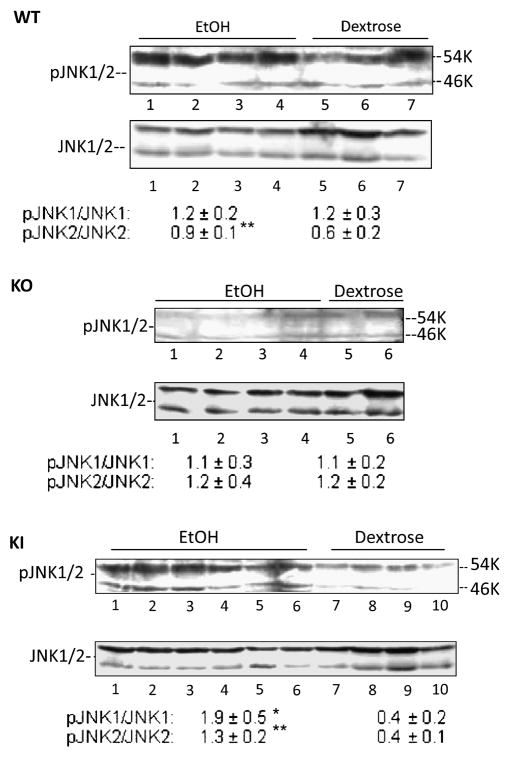
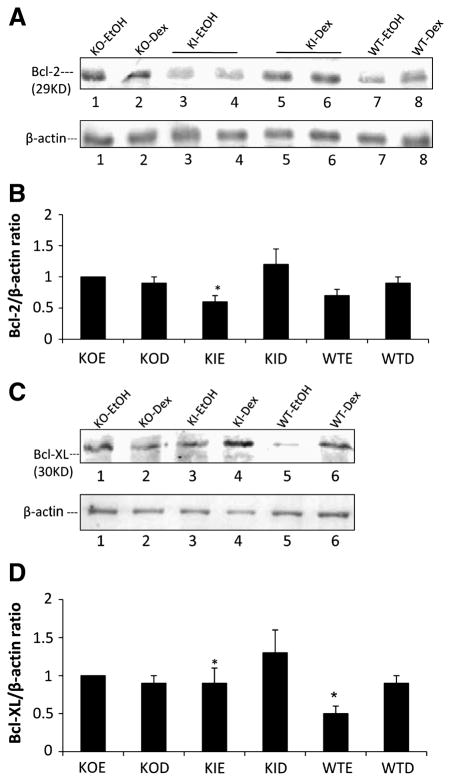
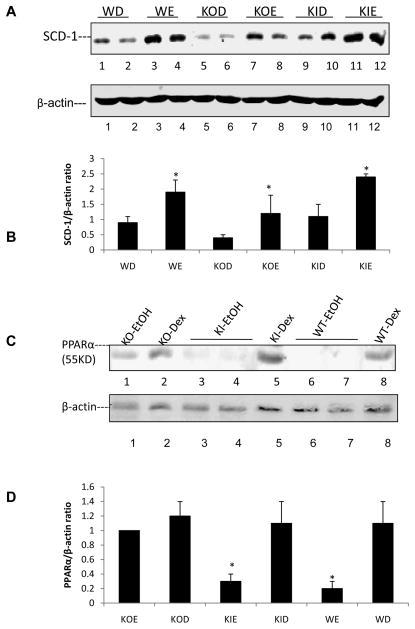
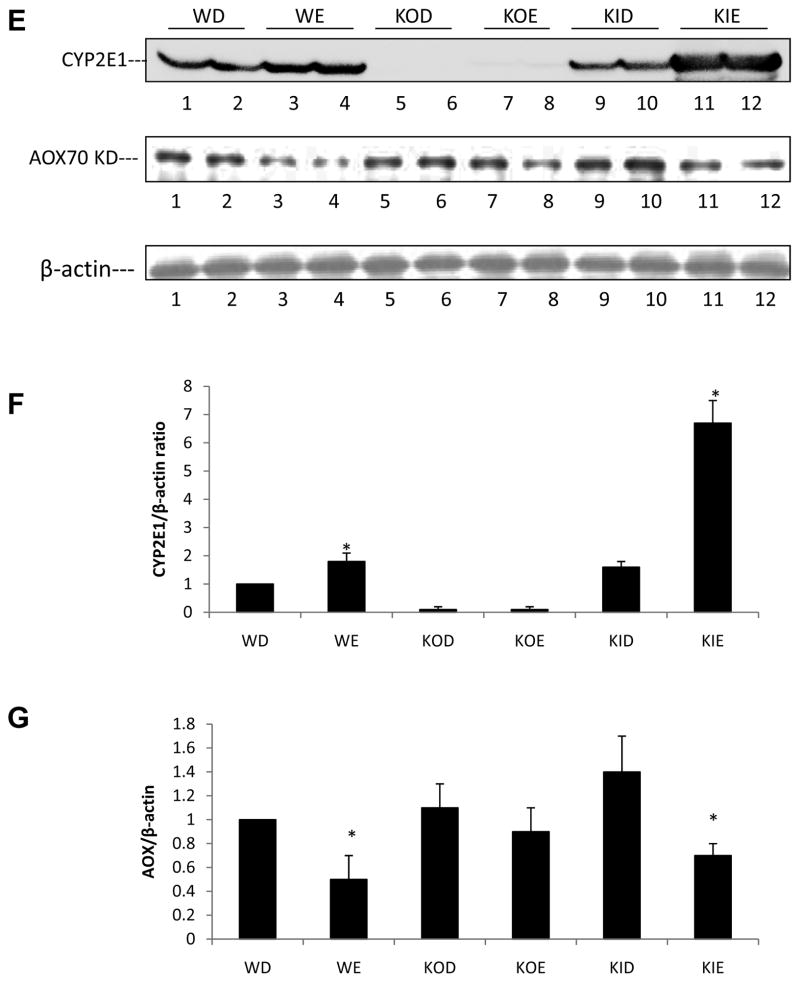
A major pathway for chronic ethanol-induced liver injury is ethanol-induced oxidant stress. Several pathways contribute to mechanisms by which ethanol induces oxidant stress. Although some studies support a role for cytochrome P450 2E1 (CYP2E1), others do not. Most previous studies were conducted in the intragastric infusion model of ethanol administration. There is a need to develop oral models of significant liver injury and to evaluate the possible role of CYP2E1 in ethanol actions in such models. We evaluated chronic ethanol-induced liver injury, steatosis, and oxidant stress in wild-type (WT) mice, CYP2E1 knock out (KO) mice, and humanized CYP2E1 knock-in (KI) mice, in which the human 2E1 was added back to mice deficient in the mouse 2E1. WT mice and the CYP2E1 KO and KI mice (both provided by Dr. F. Gonzalez, National Cancer Institute) were fed a high-fat Lieber-DeCarli ethanol liquid diet for 3weeks; pair-fed controls received dextrose. Ethanol produced fatty liver and oxidant stress in WT mice but liver injury (transaminases, histopathology) was minimal. Ethanol-induced steatosis and oxidant stress were blunted in the KO mice (no liver injury) but restored in the KI mice. Significant liver injury was produced in the ethanol-fed KI mice, with elevated transaminases, necrosis, and increased levels of collagen type 1 and smooth muscle actin. This liver injury in the KI mice was associated with elevated oxidant stress and elevated levels of the human CYP2E1 compared to levels of the mouse 2E1 in WT mice. Activation of JNK and decreased levels of Bcl-2 and Bcl-XL were observed in the ethanol-fed KI mice compared to the other groups. Fatty liver in the WT and the KI mice was associated with lower levels of PPARα and acyl-CoA oxidase. No such changes were found in the ethanol-fed KO mice. These results show that CYP2E1 plays a major role in ethanol-induced fatty liver and oxidant stress. It is the absence of CYP2E1 in the KO mice that is responsible for the blunting of steatosis and oxidant stress because restoring the CYP2E1 restores the fatty liver and oxidant stress. Moreover, it is the human CYP2E1 that restores these effects of ethanol, which suggests that results for fatty liver and oxidant stress from rodent models of ethanol intake and mouse CYP2E1 can be extrapolated to human models of ethanol intake and to human CYP2E1.


Figures

Figure 1
Figure 1. CYP2E1 activities and expression in WT, CYP2E1 knockout and humanized CYP2E1 knockin mice fed dextrose or ethanol diets
A. Western blotting analysis for CYP2E1 expression. A typical immunoblot is shown and CYP2E1/actin ratios from 3–6 pairs of mice in each group are indicated. * P <0.05 compared with dextrose group. B. Microsomal PNP activities. ** P<0.01, compared with WT dextrose (WD) group; ## P<0.01, compared with KI dextrose (KID) group; && P<0.01, compared with WT ethanol (WE) group. KOD, CYP2E1 knockout mice fed dextrose diet; KOE, CYP2E1 knockout mice fed ethanol diet; KIE, humanized CYP2E1 knockin mice fed ethanol diet. (n= 3–6 pairs of mice in each group). C. Immunohistochemistry staining to determine CYP2E1 in the liver. D. TNFα levels in liver lysates were analyzed by an ELISA method. (n= 3–6 pairs of mice in each group).
Figure 2
Figure 2. Ethanol-induced hepatotoxicity in WT, CYP2E1 knockout and humanized CYP2E1 knockin mice. Results are from 3 to 6 pairs of mice in each group
A. Serum ALT. B. Serum AST. * P<0.05 and ** P<0.01, compared with dextrose group; # P<0.05, compared with WT ethanol group; & P<0.05, compared with KO ethanol group. C. Necroinflammation scores from H&E staining. * P<0.05, compared with dextrose group; # P<0.05, compared with WT ethanol group; & P<0.05, compared with KO ethanol group. D.Hepatic triglycerides. *P<0.05 and **P<0.01 compared with dextrose group; ## P< 0.01 compared with ethanol KO group; & P< 0.05 compared with KI ethanol group; $$ P < 0.01 compared with KO ethanol group. E. Liver to body wt ratio. * P< 0.05 compared with dextrose group; # P< 0.05 compared with WT ethanol group; $ P< 0.05 compared with KO ethanol group. F. Steatosis scores from H&E staining. ** P< 0.01 compared with dextrose group; ## P< 0.01 compared with KO ethanol group; & P< 0.05 compared with KI ethanol group; $$ P <0.01 compared with KO ethanol group.
Figure 3
Figure 3. Ethanol-induced steatosis and hepatotoxicity
A.. H&E staining (low power). Arrows show lipid droplets, arrow heads show necroinflammation. B. H&E staining (high power). Arrows show single cell death, arrow heads show inflammation. Results from 2 WT and 2 KI mice are shown. C. Immunohistochemistry staining for α-smooth muscle actin. Arrows show positive staining. D. Immunohistochemistry staining for collagen αI. Arrows show positive staining. E. Oil Red O staining for lipid.
Figure 4
Figure 4. Ethanol-induced oxidative stress
Chronic ethanol induced oxidative stress was determined by measuring levels of TBARS (A), or GSH (B) in liver lysates. *, **, P<0.05 compared with their dextrose control groups respectively (n=3–6). C. Immunohistochemistry staining for 3-NT protein adducts in mouse liver. D. Immunohistochemistry staining for 4-HNE protein adducts. E. ROS detection by DHE fluorescence.
Figure 5
Figure 5. The activation of JNK MAP kinase
The phosphorylation of JNK1 or JNK2 was determined by immunoblot analysis of liver lysates. The activity was determined by the ratios of pJNK/JNK which are listed under the blots and are from 3–6 pairs of mice. *, **, P<0.05 compared with dextrose fed groups respectively.
Figure 6
Figure 6. Levels of Bcl-2 and Bcl-XL
Levels of Bcl-2 (A) and Bcl-XL (C) were determined by immunoblots. Ratios with β-actin are shown in the bar graphs (B, D) and are from 3–6 pairs of mice. *, P<0.05 compared with dextrose fed groups.
Figure 7
Figure 7. Effects of chronic ethanol on liver lipogenic and lipolytic proteins
Immunoblots were carried out to determine the levels of SCD-1 (A,), PPARα (C) and CYP2E1 plus AOX (E) proteins. *, **, P<0.05 compared with their dextrose groups respectively. The bar graphs (B, D, F, G) show the protein/actin ratios from 3–6 pairs of mice

References

    1. Nordman R, Riviere C, Rouach H. Implication of free radical mechanisms in ethanol-induced cellular injury. Free Rad Biol Med. 1992;12:219–240. - PubMed
    1. Bondy SC. Ethanol toxicity and oxidative stress. Toxicol Lett. 1992;63:231–242. - PubMed
    1. Cederbaum AI. Introduction serial review: alcohol, oxidative stress and cell injury. Free Rad Biol Med. 2001;31:1524–1526. - PubMed
    1. Arteel GE. Oxidants and antioxidants in alcohol-induced liver disease. Gastroenterology. 2003;124:778–790. - PubMed
    1. French SW, Morimoto M, Reitz RC, Koop D, Klopfenstein B, Estes, et al. Lipid peroxidation, CYP2E1 and arachidonic acid metabolism in alcoholic liver disease in rats. J Nutr. 1997;127:907S–911S. - PubMed

Publication types

MeSH terms