Activation of heat shock factor 1 plays a role in pyrrolidine dithiocarbamate-mediated expression of the co-chaperone BAG3
- PMID: 20692357
- PMCID: PMC2950225
- DOI: 10.1016/j.biocel.2010.07.021
Activation of heat shock factor 1 plays a role in pyrrolidine dithiocarbamate-mediated expression of the co-chaperone BAG3
Abstract
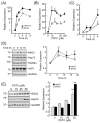
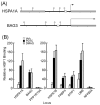
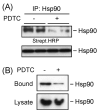
Adaptive responses to physical and inflammatory stressors are mediated by transcription factors and molecular chaperones. The transcription factor heat shock factor 1 (HSF1) has been implicated in extending lifespan in part by increasing expression of heat shock response genes. Pyrrolidine dithiocarbamate (PDTC) is a small thiol compound that exerts in vivo and in vitro anti-inflammatory properties through mechanisms that remain unclear. Here we report that PDTC induced the release of monomeric HSF1 from the molecular chaperone heat shock protein 90 (Hsp90), with concomitant increase in HSF1 trimer formation, translocation to the nucleus, and binding to promoter of target genes in human HepG2 cells. siRNA-mediated silencing of HSF1 blocked BAG3 gene expression by PDTC. The protein levels of the co-chaperone BAG3 and its interaction partner Hsp72 were stimulated by PDTC in a dose-dependent fashion, peaking at 6h. Inhibition of Hsp90 function by geldanamycin derivatives and novobiocin elicited a pattern of HSF1 activation and BAG3 expression that was similar to PDTC. Chromatin immunoprecipitation studies showed that PDTC and the inhibitor 17-dimethylaminoethylamino-17-demethoxygeldanamycin enhanced the binding of HSF1 to the promoter of several target genes, including BAG3, HSPA1A, HSPA1B, FKBP4, STIP1 and UBB. Cell treatment with PDTC increased significantly the level of Hsp90α thiol oxidation, a posttranslational modification known to inhibit its chaperone function. These results unravel a previously unrecognized mechanism by which PDTC and related compounds could confer cellular protection against inflammation through HSF1-induced expression of heat shock response genes.
Published by Elsevier Ltd.
Figures


Similar articles
-
The natural compound cantharidin induces cancer cell death through inhibition of heat shock protein 70 (HSP70) and Bcl-2-associated athanogene domain 3 (BAG3) expression by blocking heat shock factor 1 (HSF1) binding to promoters.J Biol Chem. 2013 Oct 4;288(40):28713-26. doi: 10.1074/jbc.M113.488346. Epub 2013 Aug 27. J Biol Chem. 2013. PMID: 23983126 Free PMC article.
-
Activation of heat shock factor 1 by pyrrolidine dithiocarbamate is mediated by its activities as pro-oxidant and thiol modulator.Biochem Biophys Res Commun. 2001 Feb 23;281(2):367-72. doi: 10.1006/bbrc.2001.4376. Biochem Biophys Res Commun. 2001. PMID: 11181056
-
Molecular stress-inducing compounds increase osteoclast formation in a heat shock factor 1 protein-dependent manner.J Biol Chem. 2014 May 9;289(19):13602-14. doi: 10.1074/jbc.M113.530626. Epub 2014 Apr 1. J Biol Chem. 2014. PMID: 24692538 Free PMC article.
-
New insights into the mechanism of heat shock response activation.Cell Mol Life Sci. 2008 Mar;65(6):855-61. doi: 10.1007/s00018-008-7458-y. Cell Mol Life Sci. 2008. PMID: 18239856 Free PMC article. Review.
-
Hsp90 in Cancer: Transcriptional Roles in the Nucleus.Adv Cancer Res. 2016;129:89-106. doi: 10.1016/bs.acr.2015.08.002. Epub 2015 Oct 12. Adv Cancer Res. 2016. PMID: 26916002 Free PMC article. Review.
Cited by
-
Pyrrolidine dithiocarbamate enhances hepatic glycogen synthesis and reduces FoxO1-mediated gene transcription in type 2 diabetic rats.Am J Physiol Endocrinol Metab. 2012 Feb 15;302(4):E409-16. doi: 10.1152/ajpendo.00453.2011. Epub 2011 Nov 29. Am J Physiol Endocrinol Metab. 2012. PMID: 22127228 Free PMC article.
-
Cardiomyocyte-Specific Human Bcl2-Associated Anthanogene 3 P209L Expression Induces Mitochondrial Fragmentation, Bcl2-Associated Anthanogene 3 Haploinsufficiency, and Activates p38 Signaling.Am J Pathol. 2016 Aug;186(8):1989-2007. doi: 10.1016/j.ajpath.2016.03.017. Epub 2016 Jun 17. Am J Pathol. 2016. PMID: 27321750 Free PMC article.
-
Bis is Induced by Oxidative Stress via Activation of HSF1.Korean J Physiol Pharmacol. 2014 Oct;18(5):403-9. doi: 10.4196/kjpp.2014.18.5.403. Epub 2014 Oct 17. Korean J Physiol Pharmacol. 2014. PMID: 25352760 Free PMC article.
-
BAG3 expression and sarcomere localization in the human heart are linked to HSF-1 and are differentially affected by sex and disease.Am J Physiol Heart Circ Physiol. 2021 Jun 1;320(6):H2339-H2350. doi: 10.1152/ajpheart.00419.2020. Epub 2021 May 14. Am J Physiol Heart Circ Physiol. 2021. PMID: 33989081 Free PMC article.
-
Development-dependent regulation of molecular chaperones after hypoxia-ischemia.Neurobiol Dis. 2015 Oct;82:123-131. doi: 10.1016/j.nbd.2015.06.001. Epub 2015 Jun 9. Neurobiol Dis. 2015. PMID: 26070787 Free PMC article.
References
-
- Anckar J, Sistonen L. Heat shock factor 1 as a coordinator of stress and developmental pathways. Adv Exp Med Biol. 2007;594:78–88. - PubMed
-
- Antoku K, Maser RS, Scully WJ, Jr, Delach SM, Johnson DE. Isolation of Bcl-2 binding proteins that exhibit homology with BAG-1 and suppressor of death domains protein. Biochem Biophys Res Commun. 2002;286:1003–10. - PubMed
-
- Carbone DL, Doorn JA, Kiebler Z, Ickes BR, Petersen DR. Modification of heat shock protein 90 by 4-hydroxynonenal in a rat model of chronic alcoholic liver disease. J Pharmacol Exp Ther. 2005;315:8–15. - PubMed
-
- Chen WY, Chang FR, Huang ZY, Chen JH, Wu YC, Wu CC. Tubocapsenolide A, a novel withanolide, inhibits proliferation and induces apoptosis in MDA-MB-231 cells by thiol oxidation of heat shock proteins. J Biol Chem. 2008;283:17184–93. - PubMed
-
- Chiappetta G, Ammirante M, Basile A, Rosati A, Festa M, Monaco M, et al. The antiapoptotic protein BAG3 is expressed in thyroid carcinomas and modulates apoptosis mediated by tumor necrosis factor-related apoptosis-inducing ligand. J Clin Endocrinol Metab. 2007;92:1159–63. - PubMed
Publication types
MeSH terms
Substances
Grants and funding
LinkOut - more resources
Full Text Sources
Miscellaneous

