Comparative Study
. 2010 Nov;56(5):861-71.
doi: 10.1053/j.ajkd.2010.05.017. Epub 2010 Aug 8.

Kidney function, albuminuria, and all-cause mortality in the REGARDS (Reasons for Geographic and Racial Differences in Stroke) study

Collaborators, Affiliations
Comparative Study

Kidney function, albuminuria, and all-cause mortality in the REGARDS (Reasons for Geographic and Racial Differences in Stroke) study

David G Warnock et al. Am J Kidney Dis. 2010 Nov.

Abstract

Background: Chronic kidney disease and albuminuria are associated with increased risk of all-cause mortality.

Study design: Prospective observational cohort study.

Setting & participants: 17,393 participants (mean age, 64.3 ± 9.6 years) in the REGARDS (Reasons for Geographic and Racial Differences in Stroke) Study.

Predictor: Estimated glomerular filtration rate (eGFR), urinary albumin-creatinine ratio (ACR).

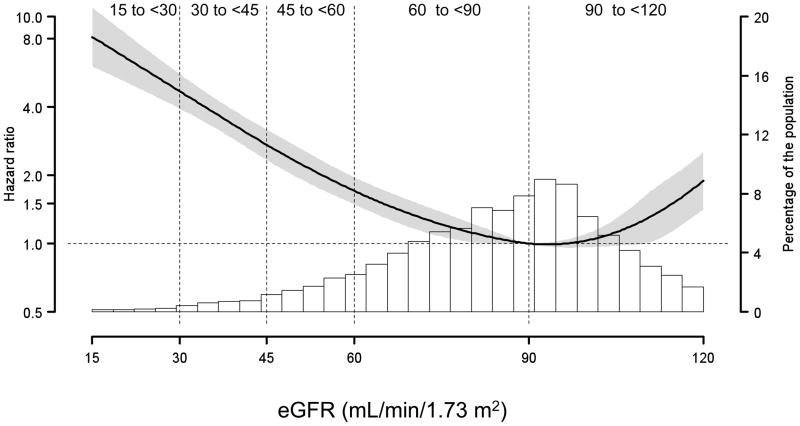
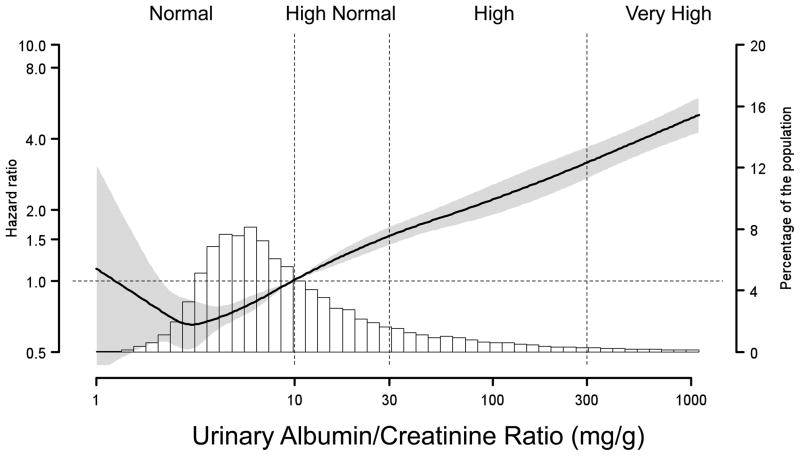
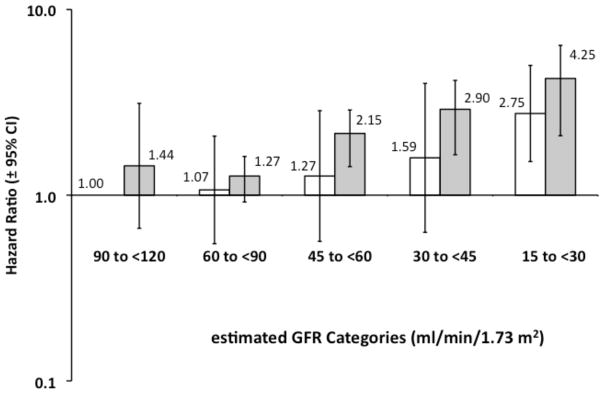
Outcome: All-cause mortality (710 deaths); median duration of follow-up, 3.6 years. MEASUREMENTS & ANALYSIS: Categories of eGFR (90 to <120, 60 to <90, 45 to <60, 30 to <45, and 15 to <30 mL/min/1.73 m(2)) and urinary ACR (<10 mg/g or normal, 10 to <30 mg/g or high normal, 30 to 300 mg/g or high, and >300 mg/g or very high). Cox proportional hazards models were adjusted for demographic factors, cardiovascular covariates, and hemoglobin level.

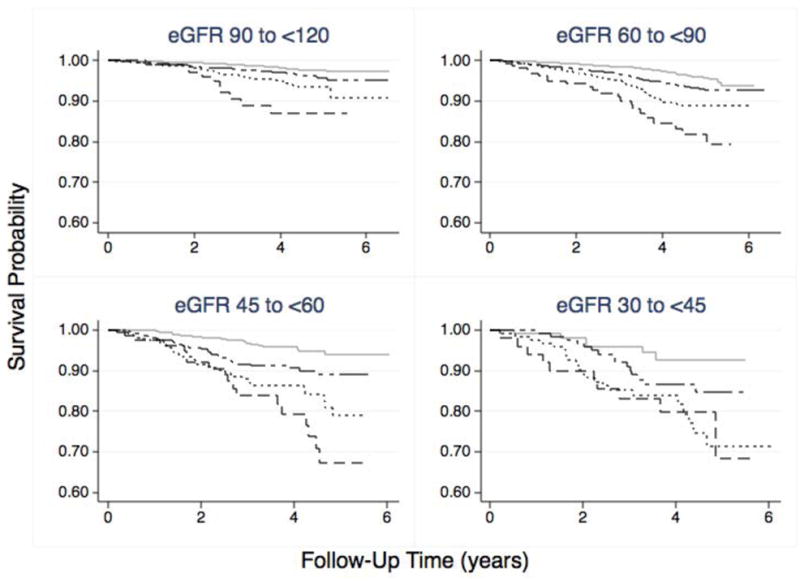
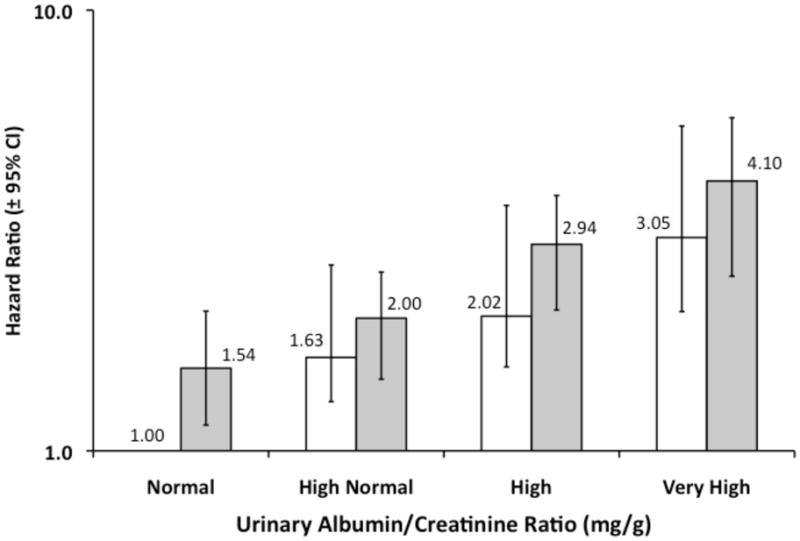
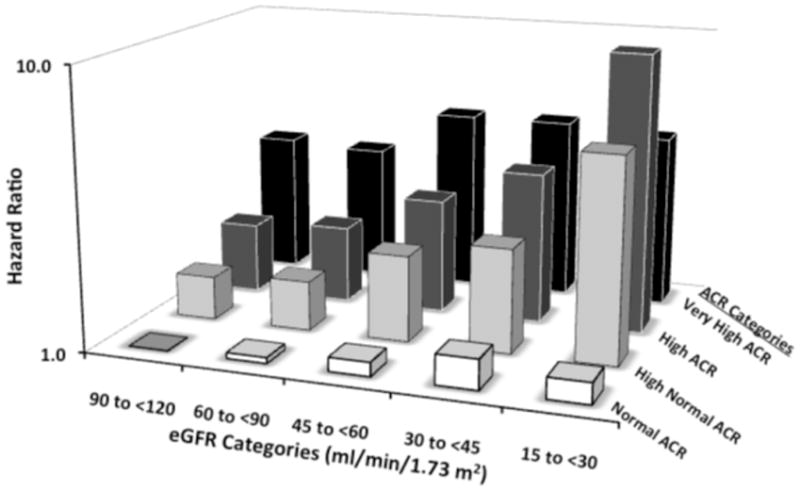
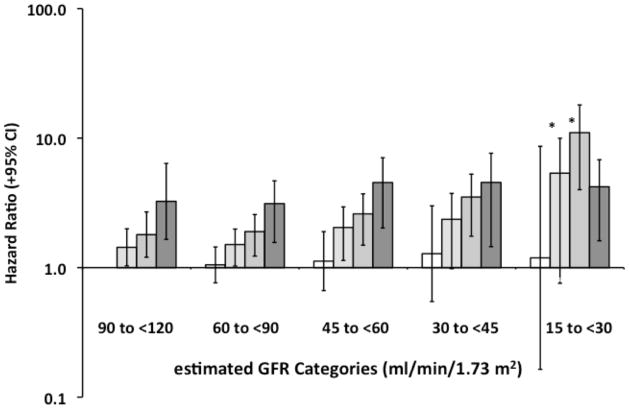
Results: The background all-cause mortality rate for participants with normal ACR, eGFR of 90 to <120 mL/min/1.73 m(2), and no coronary heart disease was 4.3 deaths/1,000 person-years. Higher ACR was associated with an increased multivariable-adjusted HR for all-cause mortality within each eGFR category. Decreased eGFR was associated with a higher adjusted HR for all-cause mortality for participants with high-normal (P = 0.01) and high (P < 0.001) ACRs, but not those with normal or very high ACRs.

Limitations: Only 1 laboratory assessment for serum creatinine and ACR was available.

Conclusions: Increased albuminuria was an independent risk factor for all-cause mortality. Decreased eGFR was associated with increased mortality risk in those with high-normal and high ACRs. The mortality rate was low in the normal-ACR group and increased in the very-high-ACR group, but did not vary with eGFR in these groups.


Figures

Figure 1
Figure 1. Hazard Ratios for All-Cause Mortality Among 17,393REGARDS Participants
Estimated glomerular filtration rate (eGFR; first panel), and urinary albumin-creatinine ratio (ACR; second panel), were treated as continuous variables and fitted in a Cox’s proportional Hazards Model using restricted quadratic spline regression, adjusted for age. Knots for the spline were placed at the 10th, 35th, 65th and 90th percentiles. The dashed horizontal lines correspond to the reference values. The reference points were set at 90 mL/min/1.73 m2, and 10 mg/g. Shaded area represents 95% CI for the hazard ratios. Histograms present the distributions of eGFR and ACR among the REGARDS participants. The dotted vertical lines separate the eGFR and ACR categories used for subsequent analysis.
Figure 2
Figure 2. Survival Plots for 17,393REGARDS Participants: All-Cause Mortality Stratified by Urinary Albumin/Creatinine Ratio (ACR), within estimated Glomerular Filtration Rate (eGFR) Categories
The survival probability curves were obtained by Kaplan-Meier analysis. The solid gray lines represent the survival probabilities for participants with Normal ACR (<10 mg/g). The long-short dashed lines represent participants with High Normal ACR (10 to <30 mg/g), the dotted lines represent participants with High ACR (30 to 300 mg/g) and the dashed lines represent survival probability for participants with Very High ACR (>300 mg/g). The eGFR categories were defined at the baseline evaluation, and the follow-up time was the difference between initial enrollment date and date of confirmed death. There were 710 deaths over an average follow up of 3.6 years. The log rank tests were significant (<0.001) for the entire cohort, as well as each of the ACR categories in each eGFR strata. The numbers at risk for each category are shown below the figure.
Figure 3
Figure 3. Hazard Ratios for All-Cause Mortality Among 17,393 REGARDS Participants: Stratified by history of Coronary Heart Disease (CHD) within Urinary Albumin-Creatinine Ratio (ACR) Categories and estimated Glomerular Filtration Rate (eGFR) categories
The hazard ratios were obtained with Cox’s proportional hazards regression for categorical analysis, and were adjusted for age, race, gender, educational status, current smoking status, body mass index, hypertension, diabetes, dyslipidemia and hemoglobin, and eGFR (upper panel) or ACR (lower panel). Open bars represent the participants without a history of CHD, and gray bars represent participants with prevalent CHD. The Hazard Ratio is presented above each bar with 95% Confidence Intervals indicated by the error bars. Linear trend analysis was significant for all 4 categorical groups. Identical results were observed when hemoglobin was omitted as a covariate.
Figure 4
Figure 4. Hazard Ratios for All-Cause Mortality Among 17,393REGARDS Participants: estimated Glomerular Filtration Rate (eGFR) and Urinary Albumin-Creatinine Ratio (ACR) Categories
The hazard ratios were obtained with Cox’s proportional hazards regression for categorical analysis, and were adjusted for age, race, gender, educational status, current smoking status, body mass index, hypertension, diabetes, dyslipidemia and hemoglobin, as well as interactions between each eGFR and ACR category. Urinary ACR categories (mg/g): Normal, <10; High Normal, 10 to <30; High, 30 to 300; Very High, >300. The P values for albuminuria trends without and with prevalent CHD were significant (P=0.006, and 0.005, respectively).
Figure 5
Figure 5. Hazard Ratios for All-Cause Mortality Among 17,393REGARDS Participants: Stratified by Urinary Albumin/Creatinine Ratio (ACR) Categories within each estimated Glomerular Filtration Rate (eGFR) category
The hazard ratios were obtained with Cox’s proportional hazards regression for categorical analysis, and were adjusted for age, race, gender, educational status, current smoking status, body mass index, hypertension, time-dependent effect of hypertension, diabetes, dyslipidemia and hemoglobin, as well as interactions between each eGFR and ACR category. Open bars represent the normal ACR category (ACR <10 mg/g), and the darker bars represent high normal, high and very high ACR categories in each eGFR strata. The high normal and high ACR series had significant P values (<0.05) for linear trends when regressed on the median eGFR for each category (*). The linear trend analyses for the normal and very high ACR categories were not significant (P value >0.4).

References

    1. Levey AS, Atkins R, Coresh J, et al. Chronic kidney disease as a global public health problem: approaches and initiatives - a position statement from Kidney Disease Improving Global Outcomes. Kidney Int. 2007;72:247–259. - PubMed
    1. Winearls CG, Glassock RJ. Dissecting and refining the staging of chronic kidney disease. Kidney Int. 2009;75:1009–1014. - PubMed
    1. Go AS, Chertow GM, Fan D, McCulloch CE, Hsu CY. Chronic kidney disease and the risks of death, cardiovascular events, and hospitalization. N Engl J Med. 2004;351:1296–1305. - PubMed
    1. Keith DS, Nichols GA, Gullion CM, Brown JB, Smith DH. Longitudinal follow-up and outcomes among a population with chronic kidney disease in a large managed care organization. Arch Intern Med. 2004;164:659–663. - PubMed
    1. Beattie JN, Soman SS, Sandberg KR, et al. Determinants of mortality after myocardial infarction in patients with advanced renal dysfunction. Am J Kidney Dis. 2001;37:1191–1200. - PubMed

Publication types