. 2010 Nov 1;19(21):4123-33.
doi: 10.1093/hmg/ddq331. Epub 2010 Aug 6.

A single-nucleotide variation in a p53-binding site affects nutrient-sensitive human SIRT1 expression

Affiliations

A single-nucleotide variation in a p53-binding site affects nutrient-sensitive human SIRT1 expression

Asma Naqvi et al. Hum Mol Genet. .

Abstract

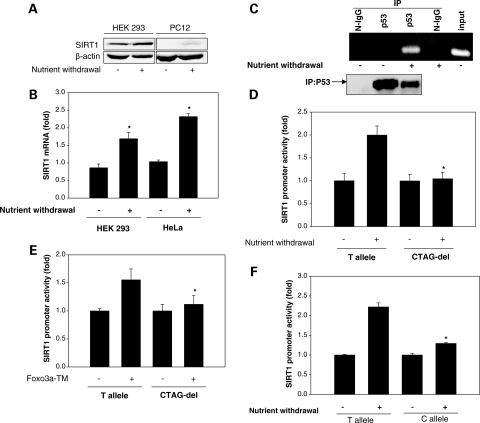
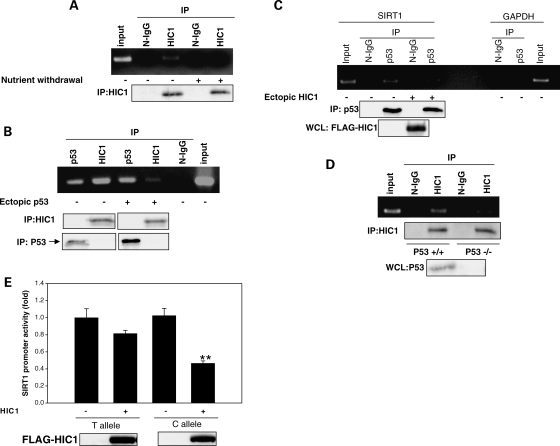
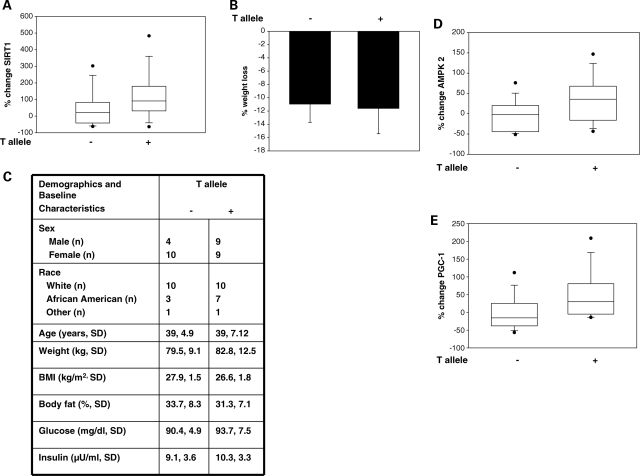
The SIRTUIN1 (SIRT1) deacetylase responds to changes in nutrient availability and regulates mammalian physiology and metabolism. Human and mouse SIRT1 are transcriptionally repressed by p53 via p53 response elements in their proximal promoters. Here, we identify a novel p53-binding sequence in the distal human SIRT1 promoter that is required for nutrient-sensitive SIRT1 transcription. In addition, we show that a common single-nucleotide (C/T) variation in this sequence affects nutrient deprivation-induced SIRT1 transcription, and calorie restriction-induced SIRT1 expression. The p53-binding sequence lies in a region of the SIRT1 promoter that also binds the transcriptional repressor Hypermethylated-In-Cancer-1 (HIC1). Nutrient deprivation increases occupancy by p53, while decreasing occupancy by HIC1, of this region of the promoter. HIC1 and p53 compete with each other for promoter occupancy. In comparison with the T variation, the C variation disrupts the mirror image symmetry of the p53-binding sequence, resulting in decreased binding to p53, decreased nutrient sensitivity of the promoter and impaired calorie restriction-stimulated tissue expression of SIRT1 and SIRT1 target genes AMPKα2 and PGC-1β. Thus, a common SNP in a novel p53-binding sequence in the human SIRT1 promoter affects nutrient-sensitive SIRT1 expression, and could have a significant impact on calorie restriction-induced, SIRT1-mediated, changes in human metabolism and physiology.


Figures

Figure 1.
Figure 1.
The C/T SNP in the human SIRT1 promoter is in a p53-binding sequence and affects p53 binding in vitro. (A) Location of the putative p53-binding sequence and the (C/T) variation in this sequence. The two HIC1-binding sites in relation to the p53 site are shown. A half-site from the consensus p53-binding sequence is displayed. Pu, purine; Py, pyrimidine. (B) Electrophoretic mobility shift assay (EMSA) showing binding of recombinant p53 to an oligonucleotide corresponding to the putative p53-binding site in the human SIRT1 promoter (SIRT1 promoter oligo-T), and to an oligonucleotide that exactly matches the consensus p53-binding site (P53 consensus oligo). (C) EMSA showing supershift with p53 antibody of recombinant p53 bound to SIRT1 promoter oligo-T. (D) EMSA showing supershift with p53 antibody of p53 expressed in HEK 293 cells bound to SIRT1 promoter oligo-T. (E) EMSA showing binding of p53 expressed in cells to SIRT1 promoter oligo-T (corresponding to the T variation in the p53-binding site), p53 consensus oligo and an oligonucleotide corresponding to the p53-binding site with the C variation (SIRT1 promoter oligo-C). Lanes are from the same gel. (F) EMSA showing binding of recombinant p53 to SIRT1 promoter oligo-T, SIRT1 promoter oligo-C and an oligonucleotide corresponding to the p53-binding site with the nucleotides CTAG deleted in the first half-site (SIRT1 promoter oligo CTAG-del). (G) EMSA showing competition for binding to recombinant p53 between SIRT1 promoter oligo-T, SIRT1 promoter oligo-C, SIRT1 promoter oligo-CTAG-del and p53 consensus oligo. Labeled SIRT1 promoter oligo-T was used in all competitions. All data shown are representative of three independent experiments.
Figure 2.
Figure 2.
The C/T SNP affects occupancy by p53 of the SIRT1 promoter. (A) ChIP assay for endogenous p53 in HEK 293 cells showing amplification of a 169 bp genomic region in the SIRT1 promoter encompassing the p53-binding site (arrow). (B) ChIP assay showing greater occupancy by p53 of the SIRT1 promoter in HeLa cells compared with HEK 293 cells. HeLa cells were transfected with p53 to achieve expression of the protein. N-IgG, non-immune IgG; p53, p53 antibody; input, non-immunoprecipitated HEK 293 cell chromatin. All data shown are representative of three independent experiments.
Figure 3.
Figure 3.
The p53-binding sequence mediates, and the C/T variation in it affects, nutrient stress-stimulated SIRT1 promoter activity. (A) Immunoblot showing increase in SIRT1 protein with nutrient withdrawal. (B) Quantitative real-time PCR showing increase in SIRT1 mRNA with nutrient withdrawal. *P < 0.05 compared with no nutrient withdrawal. (C) ChIP showing increase in occupancy of the SIRT1 promoter by p53 with nutrient withdrawal. A 169 bp genomic region in the SIRT1 promoter encompassing the p53-binding site was amplified. Non-immunoprecipitated HEK 293 cell chromatin was used as input. (D) Promoter–reporter assay in HEK 293 cells showing nutrient withdrawal-stimulated change in activity of an SIRT1 promoter with the T allele in the p53-binding sequence (T allele), and an SIRT1 promoter with deletion of CTAG nucleotides in the first half-site of the p53-binding sequence (CTAG-del). *P < 0.05 compared with T allele. (E) Promoter–reporter assay in HEK 293 cells showing active Foxo3a (TM)-stimulated change in activity of the SIRT1 T allele promoter and the SIRT1 CTAG-del promoter. *P < 0.05 compared with T allele. (F) Promoter–reporter assay in HEK 293 cells showing nutrient withdrawal-stimulated change in activity of SIRT1 promoters with the C and T alleles in the p53-binding sequence. *P < 0.05 compared with T allele. All data shown are representative of three independent experiments.
Figure 4.
Figure 4.
P53 and HIC1 compete for occupancy of the SIRT1 promoter. (A) ChIP in HEK 293 cells showing a decrease in occupancy of the SIRT1 promoter by HIC1 with nutrient withdrawal. (B). ChIP in HEK 293 cells showing a decrease in occupancy of the SIRT1 promoter by HIC1 with p53 overexpression. (C) ChIP in HEK 293 cells showing a decrease in occupancy of the SIRT1 promoter by p53 with HIC1 overexpression. (D) ChIP assay for endogenous HIC1 in p53−/− and p53+/+ HCT 116 cells. Non-immunoprecipitated HCT 116 P53+/+ chromatin was used as input. In all ChIP assays, a 179 bp genomic region in the SIRT1 promoter encompassing the two HIC1- and p53-binding sites was amplified. N-IgG, non-immune IgG; p53, p53 antibody; HIC1, HIC1 antibody. (E) Promoter–reporter assay in HEK 293 cells showing change in activity of the SIRT1 promoter with the T allele and the SIRT1 promoter with the C allele with expression of HIC1. **P<0.01 compared with T allele. All data shown are representative of three independent experiments.
Figure 5.
Figure 5.
The C/T SNP is associated with calorie restriction-induced tissue SIRT1, AMPKα2 and PGC-1β expression. (A) Presence of the T allele is associated with a larger increase in skeletal muscle SIRT1 mRNA after 6 months of CR or CREX; P = 0.035 (n = 32). (B) Presence of the T allele does not affect weight loss after 6 months of CR or CREX; P = NS (n = 32). Error bars are ±SD. (C) Demographics and baseline clinical characteristics of subjects on 6 months of CR or CREX with and without the T allele. Values are means ± SD. There was no statistical difference in any of the characteristics between those with and without the T allele. (D) Presence of the T allele is associated with a larger increase in skeletal muscle AMPKα2 mRNA after 6 months of CR or CREX; P = 0.013 (n = 32). (E) Presence of the T allele is associated with a larger increase in skeletal muscle PGC-1β mRNA after 6 months of CR or CREX; P = 0.016 (n = 32). Each box plot shows the distribution of the change in SIRT1 expression from 25 to 75th percentile, and the lines inside the boxes denote the medians. Whiskers denote the intervals between the 5 and 95th percentiles, with dots representing data points outside these percentiles.

Similar articles

Cited by

References

    1. Kaeberlein M., McVey M., Guarente L. The SIR2/3/4 complex and SIR2 alone promote longevity in Saccharomyces cerevisiae by two different mechanisms. Genes Dev. 1999;13:2570–2580. doi:10.1101/gad.13.19.2570. - DOI - PMC - PubMed
    1. Boily G., Seifert E.L., Bevilacqua L., He X.H., Sabourin G., Estey C., Moffat C., Crawford S., Saliba S., Jardine K., et al. SirT1 regulates energy metabolism and response to caloric restriction in mice. PLoS ONE. 2008;3:e1759. doi:10.1371/journal.pone.0001759. - DOI - PMC - PubMed
    1. Rodgers J.T., Lerin C., Haas W., Gygi S.P., Spiegelman B.M., Puigserver P. Nutrient control of glucose homeostasis through a complex of PGC-1alpha and SIRT1. Nature. 2005;434:113–118. doi:10.1038/nature03354. - DOI - PubMed
    1. Picard F., Kurtev M., Chung N., Topark-Ngarm A., Senawong T., Machado De Oliveira R., Leid M., McBurney M.W., Guarente L. Sirt1 promotes fat mobilization in white adipocytes by repressing PPAR-gamma. Nature. 2004;429:771–776. doi:10.1038/nature02583. - DOI - PMC - PubMed
    1. Gerhart-Hines Z., Rodgers J.T., Bare O., Lerin C., Kim S.H., Mostoslavsky R., Alt F.W., Wu Z., Puigserver P. Metabolic control of muscle mitochondrial function and fatty acid oxidation through SIRT1/PGC-1alpha. EMBO J. 2007;26:1913–1923. doi:10.1038/sj.emboj.7601633. - DOI - PMC - PubMed

Publication types