. 2010 Nov;59(11):2872-82.
doi: 10.2337/db09-1606. Epub 2010 Aug 6.

TNF-α signals through PKCζ/NF-κB to alter the tight junction complex and increase retinal endothelial cell permeability

Affiliations

TNF-α signals through PKCζ/NF-κB to alter the tight junction complex and increase retinal endothelial cell permeability

Célia A Aveleira et al. Diabetes. 2010 Nov.

Abstract

Objective: Tumor necrosis factor-α (TNF-α) and interleukin-1 beta (IL-1β) are elevated in the vitreous of diabetic patients and in retinas of diabetic rats associated with increased retinal vascular permeability. However, the molecular mechanisms underlying retinal vascular permeability induced by these cytokines are poorly understood. In this study, the effects of IL-1β and TNF-α on retinal endothelial cell permeability were compared and the molecular mechanisms by which TNF-α increases cell permeability were elucidated.

Research design and methods: Cytokine-induced retinal vascular permeability was measured in bovine retinal endothelial cells (BRECs) and rat retinas. Western blotting, quantitative real-time PCR, and immunocytochemistry were performed to determine tight junction protein expression and localization.

Results: IL-1β and TNF-α increased BREC permeability, and TNF-α was more potent. TNF-α decreased the protein and mRNA content of the tight junction proteins ZO-1 and claudin-5 and altered the cellular localization of these tight junction proteins. Dexamethasone prevented TNF-α-induced cell permeability through glucocorticoid receptor transactivation and nuclear factor-kappaB (NF-κB) transrepression. Preventing NF-κB activation with an inhibitor κB kinase (IKK) chemical inhibitor or adenoviral overexpression of inhibitor κB alpha (IκBα) reduced TNF-α-stimulated permeability. Finally, inhibiting protein kinase C zeta (PKCζ) using both a peptide and a novel chemical inhibitor reduced NF-κB activation and completely prevented the alterations in the tight junction complex and cell permeability induced by TNF-α in cell culture and rat retinas.

Conclusions: These results suggest that PKCζ may provide a specific therapeutic target for the prevention of vascular permeability in retinal diseases characterized by elevated TNF-α, including diabetic retinopathy.


Figures
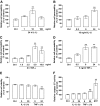
FIG. 1.
FIG. 1.
IL-1β and TNF-α increase retinal endothelial cell permeability. A–D: BRECs were grown to confluence on transwell filters and then exposed to IL-1β or TNF-α in a concentration- and time-dependent manner. The monolayer permeability to 70 kDa dextran was measured as described in research design and methods. A: Cells were treated with 1, 10, and 100 ng/ml IL-1β for 24 h. B: Cells were treated with 10 ng/ml IL-1β for 0.5, 6, and 24 h. C: Cells were treated with 1, 2.5, 5, and 10 ng/ml TNF-α for 6 h. D: Cells were treated with 5 ng/ml TNF-α for 0.5, 6, and 24 h. E and F: IL-1β and TNF-α effect on cell viability. BRECs were treated with 10 ng/ml IL-1β or 5 ng/ml TNF-α for 6 and 24 h. E: Relative cell viability was measured by calcein AM cleavage by live cells. F: Retinal endothelial cell apoptosis was evaluated by caspase-3/7 activation. As a positive control of apoptosis induction, cells were treated with 100 nmol/l staurosporine (STP) for 6 h. The results represent the mean ± SEM of at least four independent experiments and are expressed relative to control (Ctrl). **P < 0.01, significantly different from control as determined by ANOVA followed by Dunnett post hoc test.
FIG. 2.
FIG. 2.
TNF-α alters tight junction proteins content and cell localization. BRECs were treated with 5 ng/ml TNF-α for 0.5 and 6 h. Whole-cell extracts were assayed for ZO-1 (A), claudin-5 (B), and occludin (C) immunoreactivity by Western blotting. Representative Western blots for each tight junction protein and β-actin (loading control) are presented above each respective graph. The results are normalized to β-actin and represent the mean ± SEM of at least five independent experiments and are expressed as the relative amount compared with control (Ctrl). *P < 0.05, **P < 0.01, significantly different from control as determined by ANOVA followed by Dunnett post hoc test. Total RNA was isolated after 6 h of TNF-α treatment, and the transcript levels of ZO-1 (D), claudin-5 (E), and occludin (F) were analyzed by qPCR. Glyceraldehyde-3-phosphate dehydrogenase was used as an endogenous control. Results represent the mean ± SEM of eight independent experiments and are expressed as the relative amount compared with control conditions. *P < 0.05, ***P < 0.001, significantly different from control as determined by Student t test. G: Cells were immunolabeled for ZO-1, claudin-5, and occludin 6 h after TNF-α treatment, and 10 confocal Z-stacks were taken through 2.56 μm and projected into one image. Arrows indicate continuous staining at cell borders. These results are representative of four independent experiments. Scale bar, 25 μm.
FIG. 3.
FIG. 3.
Dexamethasone prevents TNF-α–induced cell permeability through transactivation of the glucocorticoid receptor. A: BRECs were grown to confluence on transwell filters and treated with 50 ng/ml dexamethasone (Dex) 18 h before TNF-α treatment (5 ng/ml, 6 h). B: Cells were treated with 5 μmol/l RU486 1 h before Dex treatment. The monolayer permeability to 70 kDa dextran was measured as described in research design and methods. The results represent the mean ± SEM of at least seven independent experiments and are expressed relative to control (Ctrl). *P < 0.05, ***P < 0.001, significantly different as determined by ANOVA followed by Bonferroni post hoc test.
FIG. 4.
FIG. 4.
Dexamethasone prevents TNF-α–induced alterations in the tight junction complex. Confluent BRECs were treated with 50 ng/ml Dex 18 h before TNF-α treatment (5 ng/ml, 6 h). Whole-cell extracts were assayed for (A) ZO-1, (B) claudin-5, and (C) occludin immunoreactivity by Western blotting as described in research design and methods. Representative Western blots for each tight junction protein and β-actin (loading control) are presented above each respective graph. The results are normalized to β-actin and represent the mean ± SEM of at least five independent experiments and are expressed as the relative amount compared with control. *P < 0.05, **P < 0.01, ***P < 0.001, significantly different from control; #P < 0.05, ##P < 0.01, ###P < 0.001, significantly different from TNF-α, as determined by ANOVA followed by Bonferroni post hoc test. D: Cells were immunolabeled for ZO-1, claudin-5, and occludin and 10 confocal Z-stacks were taken through 2.56 μm and projected into one image. These results are representative of four independent experiments. Scale bar, 25 μm.
FIG. 5.
FIG. 5.
Effect of NF-κB inhibition on TNF-α–induced cell permeability. A: Cells were incubated with 1 μmol/l IKK VII, 30 min before the addition of 5 ng/ml TNF-α for 5 min. Whole-cell lysates were assayed for phophorylated IκBα (Ser32/Ser36) and total IκBα immunoreactivity by Western blotting. B: Cells were grown to confluence on transwell filters and then treated with 1 μmol/l IKK VII 30 min before TNF-α addition (5 ng/ml, 6 h). The monolayer permeability to 70 kDa dextran was measured as described. C–E: Adenovirus-mediated overexpression of IκBα. BRECs were transduced with AdEmpty or AdIκBα as described. C: Whole lysates of BRECs were used to detect IκBα, GFP, and β-actin (loading control) by Western blotting. D: After 28 h of adenovirus transduction, cells were exposed to 5 ng/ml TNF-α for 2 h. Total RNA was isolated, and the transcript levels of IL-8 were analyzed by qPCR. E: Cells were grown to confluence on transwell filters and after 24 h of adenovirus transduction cells were treated with 5 ng/ml TNF-α for 6 h. The monolayer permeability to 70 kDa dextran was measured. The results represent the mean ± SEM of at least three independent experiments and are expressed relative to control (Ctrl). *P < 0.05, **P < 0.01, ***P < 0.001, significantly different as determined by ANOVA followed by Bonferroni post hoc test.
FIG. 6.
FIG. 6.
Inhibition of PKCζ inhibits NF-κB activation by TNF-α. A: BRECs were treated with 10 μmol/l PKCζI-1, a PKCζ inhibitor, 30 min before the addition of 5 ng/ml TNF-α for 2 h. Total RNA was isolated, and the transcript levels of IL-8 were analyzed by qPCR. The results represent the mean ± SEM of six independent experiments and are expressed relative to control (Ctrl). B: 293T-NF-kB-luc cells, with a κB-dependent luciferase reporter gene, were treated with 10 or 50 μmol/l PKCζI-1 30 min prior to the addition of TNF-α for 6 h. Cells were harvested, and luciferase activity was determined in whole-cell lysates. The results represent the mean ± SEM of four independent experiments and are expressed relative to TNF-α. ***P < 0.001, significantly different from control; #P < 0.05, ##P < 0.01, ###P < 0.001, significantly different from TNF-α, as determined by ANOVA followed by Bonferroni post hoc test.
FIG. 7.
FIG. 7.
TNF-α increases cell permeability in a PKCζ-dependent manner. BRECs were grown to confluence on transwell filters and then treated with (A) 2 μmol/l LY294002 (LY), (B) 10 μmol/l PKCζI-1, and (C) 250 nmol/l PKCζ pseudosubstrate inhibitor (PKCζp). The monolayer permeability to 70 kDa dextran was measured as described. Results represent the mean ± SEM of at least five experiments and are expressed relative to Ctrl. D–F: PKCζI-1 prevents tight junction complex disruption induced by TNF-α. Whole-cell extracts were assayed for (D) ZO-1, (E) claudin-5, and (F) occludin immunoreactivity by Western blotting. Representative Western blots for each tight junction protein and β-actin (loading control) are presented above each respective graph. The results are normalized to β-actin and represent the mean ± SEM of at least eight independent experiments and are expressed as the relative amount compared with control (Ctrl). All inhibitors were added to the cell culture medium 30 min before TNF-α addition (5 ng/ml, 6 h). *P < 0.05, **P < 0.01, ***P < 0.001, significantly different from control; #P < 0.05, ##P < 0.01, ###P < 0.001, significantly different form TNF-α, as determined by ANOVA followed by Bonferroni post hoc test.
FIG. 8.
FIG. 8.
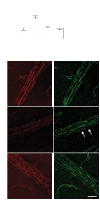
PKCζI-1 prevents TNF-α–induced retinal vascular permeability in vivo. Animals' eyes were injected with PBS with 0.1% BSA, TNF-α (10 ng); PKCζI-1 (280 ng); or with both PKCζI-1 and TNF-α. A: Evans blue leakage was evaluated 24 h after intravitreous injections. The results represent the mean ± SEM (n = 7–8 animals per group) and are expressed relative to control (Ctrl; PBS-injected eyes). **P < 0.01, significantly different from control; ##P < 0.01, significantly different from TNF-α, as determined by ANOVA followed by Bonferroni post hoc test. B: PKCζI-1 prevents the alterations in tight junction proteins induced by TNF-α in vivo. Whole retinas were immunolabeled for ZO-1 and occludin 4 h after injection. Images were obtained on a Leica TCS SP2 AOBS confocal microscope and are presented as a maximum projection. Arrows indicate loss and/or discontinuous cell border staining. Scale bar, 25 μm. (A high-quality digital representation of this figure is available in the online issue.)

References

    1. Antonetti DA, Barber AJ, Bronson SK, Freeman WM, Gardner TW, Jefferson LS, Kester M, Kimball SR, Krady JK, LaNoue KF, Norbury CC, Quinn PG, Sandirasegarane L, Simpson IAJDRF Diabetic Retinopathy Center Group Diabetic retinopathy: seeing beyond glucose-induced microvascular disease. Diabetes 2006;55:2401–2411 - PubMed
    1. Gardner TW, Larsen M, Girach A, Zhi Xon behalf of the Protein Kinase C Diabetic Retinopathy Study (PCK-DRS2) Study Group Diabetic macular oedema and visual loss: relationship to location, severity and duration. Acta Ophthalmol 2009;87:709–713 - PubMed
    1. Moss SE, Klein R, Klein BE. The 14-year incidence of visual loss in a diabetic population. Ophthalmology 1998;105:998–1003 - PubMed
    1. Sander B, Thornit DN, Colmorn L, Strøm C, Girach A, Hubbard LD, Lund-Andersen H, Larsen M. Progression of diabetic macular edema: correlation with blood retinal barrier permeability, retinal thickness, and retinal vessel diameter. Invest Ophthalmol Vis Sci 2007;48:3983–3987 - PubMed
    1. Diabetic Retinopathy Clinical Research Network, Browning DJ, Glassman AR, Aiello LP, Beck RW, Brown DM, Fong DS, Bressler NM, Danis RP, Kinyoun JL, Nguyen QD, Bhavsar AR, Gottlieb J, Pieramici DJ, Rauser ME, Apte RS, Lim JI, Miskala PH. Relationship between optical coherence tomography-measured central retinal thickness and visual acuity in diabetic macular edema. Ophthalmology 2007;114:525–536 - PMC - PubMed

Publication types

MeSH terms